Risk management in GVCs amidst the COVID-19 pandemic
Дробот Е.В.1,2![]()
1 PRIMEC Publishers, Россия, Москва
2 Centre for Extra-curricular Professional Education, Россия, Москва
Скачать PDF | Загрузок: 92 | Цитирований: 6
Статья в журнале
Экономическая безопасность (РИНЦ, ВАК)
опубликовать статью | оформить подписку
Том 5, Номер 1 (Январь-март 2022)
Эта статья проиндексирована РИНЦ, см. https://elibrary.ru/item.asp?id=48121713
Цитирований: 6
Аннотация:
Amidst the COVID-19 pandemic, global value chains are under threat. Thus, the analysis of the pandemic impact on GVCs is important. Based on the analysis of the APEC main economic indicators, the COVID-19 pandemic impact on the supply chains in the region was assessed. The concept of GVC Sustainability Star is presented, which helps to concretize and counteract the GVC sustainability risks. It was concluded that amidst the pandemic crisis and its consequences, concerted efforts of APEC member economies are needed to increase GVC sustainability and develop unified energy policy standards.
Ключевые слова: APEC, global value chain, pandemic, risk management, sustainability
Финансирование:
The article was prepared in the framework of participation in the International Scientific and Practical Conference “The 6th Senchagov Readings” on the topic: “Russia\'s Economic Security in the New Reality”, Moscow: Institute of Economics, Russian Academy of Sciences, March 30–31, 2022.
JEL-классификация: F02, F14, F15, F63, F52
1. Introduction
Global value chains (hereinafter GVCs) have become an important aspect of international trade and globalization today. In the 21st century, they have become increasingly important due to the liberalization of foreign economic activity and the reduction of trade barriers. At the same time, companies operating in international markets, participating in the GVCs, strive to organize their production in those countries and regions where production costs may be lower [1] (Ignatenko, Raei, Mircheva, 2019).
Over the past 20 years, a large number of scientific studies on the GVC particularities have been conducted.
Moreover, as a kind of reference point in the study of global value chains, it seems possible to consider Michael Porter’s fundamental work “Competitive Advantage: Creating and Sustaining Superior Performance”, first published in 1985 [2] (Porter, 1985). According to Porter (1985) [3] (Porter, 2011), the value chain includes all those activities that an organization performs to create value for its customers. In the business process, organizations create new value. The more this newly created value is, the more profitable the organization becomes. The ultimate goal of creating value is to gain a competitive advantage over competitors in the market.
Some studies focus on identifying key areas or elements of supply chain sustainability or resilience. For example, the World Economic Forum has identified five GVC resilience elements:
1. Improving information exchange between governments and businesses;
2. Harmonization of legislative and regulatory standards;
3. Formation of a risk management culture among suppliers;
4. General approaches to risk assessment;
5. Improved risk warning systems [4].
Another approach to determining the GVC sustainability is to evaluate key performance indicators (KPIs) at the firm level. This approach is based on quantitative indicators to monitor ongoing processes. An example is the analytical products of a company that measures supply chain sustainability factors such as transparency, network resilience, continuity, reliability, performance and maturity of the GVC sustainability program [5].
At the international level, the standard ISO 28002:2011 “Security management systems for the supply chain – Development of resilience in the supply chain – Requirements with guidance for use”, IDT) is accepted [6]. This standard provides the following definitions. The supply chain is an interconnected set of resources and processes starting with the search for raw materials and spreading through the delivery of products or services to the final consumer through multimodal transportation. Resilience is the ability to cope and adapt to a complex and changing environment. Sustainability is the ability of a system to maintain its functions and structure in the face of internal and external changes, which can gradually deteriorate. Sustainability is the ability of an organization to prevent or resist the impact of an event or the ability to return to an acceptable level of performance and in an acceptable period of time after the impact of an event [6].
In our opinion, the approach to assessing the value chain sustainability suggested by Sangaraju and Bayhaqi [7] (Sangaraju, Bayhaqi, 2020) is of particular interest. Sangaraju and Bayhaqi (2020) introduce the concept of GVC resilience, or the strength of an economy or a regional grouping against systemic risks. The concept of value chain strength is considered as the inverse value of risk: a range of factors determining the ability of an economy to respond to risks, limit their economic and social consequences and restore the state of the value chain at the pre-crisis level [7] (Sangaraju, Bayhaqi, 2020). Sangaraju and Bayhaqi [7] (Sangaraju, Bayhaqi, 2020) use the term “supply chain strength or resilience” and particularize pillars of supply chain strength, taking into account existing systemic risks. The five pillars of supply chain strength are as follows:
1. Strength against logistics and infrastructure risk;
2. Strength against market risk;
3. Strength against natural disasters risk;
4. Strength against political risks;
5. Strength against regulatory and policy risks.
2. Materials and Methods
The purpose of the study is as follows:
· Based on the analysis of the main economic indicators of APEC member economies, an assessment of the COVID-19 pandemic impact on the supply chains in the region has been made;
· The authors concept of GVC Sustainability Star is presented; and the GVC sustainability factors have been identified;
· Recommendations on countering the GVC sustainability risks have been suggested.
The data of the World Bank (hereinafter World Bank), the World Trade Organization (hereinafter WTO), the World Economic Forum (hereinafter WEF), the International Monetary Fund (hereinafter IMF), the United Nations (hereinafter UN), the Organization for Economic Cooperation and Development (hereinafter OECD), etc. were used as the information base of the research.
In the course of the research, the methods of economic and mathematical modeling and econometric methods of analysis were used.
3. Results
3.1. Risks of global value chains
Due to the global nature of the production networks, there are significant risks. In general, firms face two main types of risks participating in the GVCs: systemic and non-systemic [8]. Systemic risk should be understood as the risk or probability of failures in the entire supply chain, as opposed to failures in its individual parts or components [9, p. 371–391] (Kaufman, Scott, 2003, p. 371–391). This type of risk threatens the market as a whole and individual business in particular. Non-systemic risk arises in a single company. Thus, it can be predicted and assessed on its own.
The World Economic Forum (hereinafter WEF) identifies 31 global risks in the GVSc, including global pandemics, financial crises and infrastructure failures, etc. [10] (Figure 1).
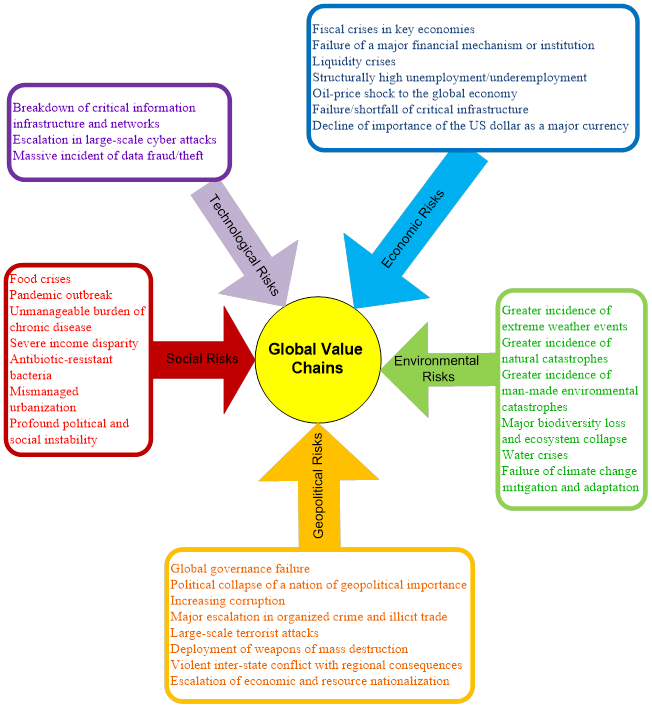
Figure 1. Risks of global value chains
Source: own elaboration on the basis of [11, p. 13].
Firms often face systemic risks. These risks, as it has already been mentioned before, can cripple the entire economy and cannot be eliminated by firm-level risk reduction strategies applied to non-systemic risks such as diversification. As a rule, systemic risks are not under the firms’ control and are often associated with unexpected events on a global scale. Uncontrolled risks are the most significant among the risks faced by participants in global supply chains. Such risks include, for example, natural disasters, extreme weather conditions, etc. [12] (McCarthy, 2020). In addition, taking into account how integrated and interconnected many value chains have become, local systemic risks can easily turn into regional or even global ones. A local incident can find several transmission channels, which can boost the initial impact at the global level and have an impact on many stakeholders in different countries.
Given that firms and economies are exposed to systemic risks due to their participation in the GVCs, it is necessary to ensure their value chains sustainability.
Sustainability here refers to the ability of a country or a company to quickly restore normal activity which is of particular importance for the Asia-Pacific region, where several key business centers are located.
The general economic and global consequences of supply chain disruptions suggest that governments need to support firms in managing such risks. Recent events have only underlined the importance of this kind of support. The COVID-19 pandemic, in particular, had a devastating impact on the economy of the Asia-Pacific region, as the restrictions on movement associated with the pandemic led to the shutdown of some supply chains and stopped the production of a number of goods (for example, cars, electronics, medical products) [13] (Rybalko, 2021).
That is why it is of interest to study the features of risk management in global value chains in the Asia-Pacific region amid the COVID-19 pandemic.
It should be noted that the dynamic economic development of the Asia-Pacific region cannot but affect the development of economic cooperation in order to provide mutual support for countries and territories in the region. That is why at the end of the 1980s (namely, in 1989), an association called Asia-Pacific Economic Cooperation (hereinafter APEC) was created. The decision to establish APEC in 1989 was made by 12 founding members: Australia, Canada, Brunei Darussalam, Indonesia, Japan, the Republic of Korea, Malaysia, New Zealand, the Philippines, Singapore, Thailand and the USA. Since 1994, new states have joined APEC. There are currently 21 member economies. They are as follows: Australia, Brunei Darussalam, Canada, Chile, China, Hong Kong SAR (China), Indonesia, Japan, the Republic of Korea, Malaysia, Mexico, New Zealand, Papua New Guinea, Peru, Philippines, the Russian Federation, Singapore, Chinese Taipei, Thailand, the United States of America and Vietnam. APEC is one of the few international associations to which Taiwan has joined with the full approval of China (in our study it will be referred to as Chinese Taipei). Therefore, APEC adopted the term “member economy” instead of “member country” [14, p. 110–120] (Drobot, 2021, p. 110–120). Apparently, APEC is distinguished by a wide geography of member economies, uniting both the global leaders (the USA, China) and small economies of the South Pacific region (Papua New Guinea) [15, p. 279–306] (Drobot, 2020, p. 279–306).
3.2. Analyzing the Main Economic Indicators of APEC Member Economies
Before proceeding to assess the GVC sustainability in the APEC region, a brief economic overview of APEC member economies should be given.
APEC members account for 38.33% of the world population, of which China, the USA and Indonesia account for 26.42%. APEC’s total GDP is approximately 55.58% of world GDP, of which China and the USA account for 34.24% (Table 1). APEC accounts for approximately 49% of world trade [16].
In recent decades, APEC has been the main economic organization in the region that has promoted free trade and economic cooperation.
The role of APEC has increased in recent years. At the present time the association deals with both economic issues, such as trade liberalization, business procedures facilitation, economic and technical cooperation, and social issues (environment, education, women’s rights, etc.) [17] (Lupan, 2014). The aim of APEC is to increase the prosperity of the region’s population.
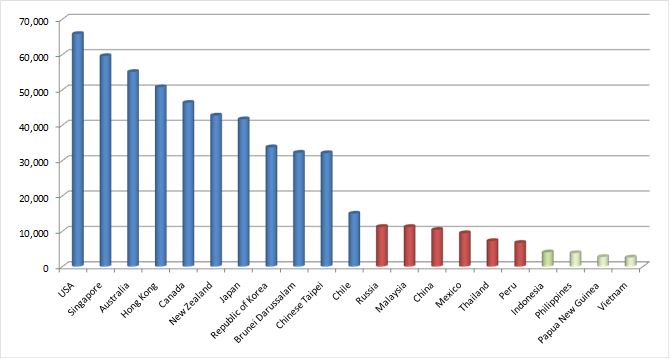
Eleven APEC member economies are high income countries. According to the methodology of the World Bank in 2021, these are countries with a per capita income more than $12,695 [18]. The leaders are the USA, Singapore and Australis. Chile is also classified as a coutry with high income, but it significantly lags befind the leaders. Six APEC member economies, including Russia and China, are upper-middle income countries. Indonesia, the Philippines, Papua New Guinea and Vietnam are classifiead as lower-middle income countries (Figure 2).
Table 1
Key economic indicators of APEC member economies
|
APEC Member Economies
|
GDP (PPP, USD billion) (IMF, 2020) [19]
|
GDP
(PPP, World GDP Share, %) (IMF, 2020) [19]
|
GNI per Capita, USD (World Bank, 2021) [20]
|
Population
(2020), million [19]
|
National Debt to GDP Ratio (2020) [21]
|
GDP
Growth Rate, % (2021) [22]
|
Inflation Rate, % (2021)
[23]
|
Unemployment
Rate, % (2021) [24]
|
Trade Balance, USD million (2020) [25]
|
Trade
Openness, % (2018) [26]
|
|
Australia
|
1,330
|
1.01
|
55,100
|
26.2
|
24.8
|
9.6
|
3.8
|
4.6
|
49.97
|
43.26
|
|
Brunei Darussalam
|
28.7
|
0.02
|
32,230
|
0.4
|
2.6
|
-2.1
|
1.5
|
8.4
|
NA
|
93.90
|
|
Canada
|
1,852
|
1.40
|
46,370
|
38.4
|
118
|
12.7
|
4.1
|
6.9
|
-32.98
|
66.58
|
|
Indonesia
|
3,302
|
2.50
|
4,050
|
277.3
|
38.5
|
7.07
|
1.6
|
6.26
|
18.62
|
43.07
|
|
Japan
|
5,312
|
4.03
|
41,710
|
125.4
|
266
|
7.6
|
1.6
|
2.8
|
-6.20
|
36.82
|
|
Republic of Korea
|
2,317
|
1.76
|
33,790
|
51.7
|
42.6
|
6.0
|
2.5
|
3.0
|
65.76
|
78.99
|
|
Malaysia
|
904
|
0.69
|
11,230
|
34.0
|
60.7
|
16.1
|
2.0
|
4.6
|
21.78
|
130.43
|
|
New Zealand
|
216
|
0.16
|
42,760
|
5.0
|
30.1
|
17.4
|
3.3
|
4.0
|
2.57
|
55.49
|
|
Philippines
|
919
|
0.70
|
3,850
|
110.6
|
53.5
|
11.8
|
4.8
|
6.9
|
-18.76
|
72.16
|
|
Singapore
|
560
|
0.42
|
59,590
|
5.7
|
131.0
|
6.5
|
2.4
|
2.7
|
108.52
|
325.34
|
|
Thailand
|
1,273
|
0.96
|
7,260
|
69.4
|
50.5
|
7.5
|
1.68
|
1.9
|
24.67
|
120.88
|
|
USA
|
20,894
|
15.83
|
65,850
|
333.4
|
108
|
12.2
|
5.4
|
4.8
|
-681.71
|
27.49
|
|
Chinese Taipei
|
1,316
|
1.00
|
32,123*
|
23.7
|
28.2
|
7.43
|
2.63
|
4.08
|
NA
|
NA
|
|
Hong Kong SAR, China
|
443
|
0.34
|
50,800
|
7.5
|
38.4
|
7.6
|
1.6
|
4.7
|
6.75
|
376.93
|
|
China
|
24,191
|
18.33
|
10,410
|
1,449.0
|
66.8
|
7.9
|
0.7
|
5.1
|
369.67
|
37.46
|
|
Mexico
|
2,439
|
1.85
|
9,480
|
126.0
|
52.1
|
19.6
|
6.0
|
4.3
|
24.27
|
80.56
|
|
Papua
New Guinea
|
33.6
|
0.03
|
2,750
|
8.7
|
48.9
|
-3.8
|
3.3
|
2.7
|
NA
|
NA
|
|
Chile
|
455
|
0.34
|
15,010
|
20.1
|
33.0
|
18.1
|
5.3
|
8.5
|
13.37
|
57.32
|
|
Peru
|
398
|
0.30
|
6,740
|
32.1
|
35.4
|
41.9
|
5.23
|
10.0
|
NA
|
48.64
|
|
Russia
|
4,100
|
3.11
|
11,260
|
146.1
|
17.8
|
10.5
|
7.4
|
4.4
|
74.43
|
51.58
|
|
Vietnam
|
1,061
|
0.80
|
2,590
|
98.2
|
46.7
|
-6.17
|
2.06
|
3.72
|
NA
|
208.31
|
|
APEC, total
|
73,344.3
|
55.58
|
–
|
2,988.9
|
–
|
–
|
–
|
–
|
–
|
–
|
|
World, total
|
131,656
|
100.00
|
–
|
7,794.79
|
–
|
–
|
–
|
–
|
–
|
–
|
Source: own elaboration on the basis of [19–26].
Notes:
|
|
– high income
countries (more than 12,695 USD);
|
|
– upper-middle income
countries (4,096–12,695 USD);
|
|
– lower-middle income
countries (1,046–4,096 USD).
|
Source: own elaboration on the basis of [18, 20].
Japan, Singapore, Canada and the USA are the “leaders” among the APEC member economies in terms of the national debt to GDP ratio. For these four countries this indicator exceeds 100% of GDP: Japan (266%), Singapore (131%), Canada (118%), and the USA (108%) (Fig. 3a). Brunei Darussalam has the lowest national debt to GDP ratio (2.6%); and Russia goes the second (17.8%). According to the GDP growth rates, three APEC member economies maintained negative dynamics in 2021. These are Brunei Darussalam, Papua New Guinea and Vietnam (Fig. 3b). Peru shows the highest GDP growth rate (41.9%). The maximum inflation rate in the APEC region in 2021 is observed in Russia (7.4%); and the minimum one is in China (0.7%) (Fig. 3c). The average unemployment rate in the APEC region in 2021 is 4.96%. In three APEC member economies it exceeded 8%: Peru (10%), Chile (8.5%) and Brunei Darussalam (8.4%) (Fig. 3d). According to the trade balance, four APEC member economies are net importers. These are Japan, the Philippines, Canada and the USA. The trade balances of these member economies in 2020 were negative, with the maximum value in the United States (-681.71 USD million) (Fig. 3e). The remaining APEC member economies are net exporters. China (369.67 USD million) and Singapore (108.52 USD million) are leading. In terms of economic openness, calculated as the ratio of exports and imports to GDP, Asian member economies such as Hong Kong SAR (China), Singapore, Vietnam, Malaysia and Thailand are significantly ahead of their APEC partners (Fig. 3f). In particular, Hong Kong SAR (China) (376.93%) is 10 times ahead of China (37.46%).
|
(a) |
(b) |
|
(c) |
(d) |
|
(e) |
(f) |
Figure 3. APEC member economies’ key economic indicators: (a) APEC member economies’ debt to GDP ratio (2020) [21]; (b) APEC member economies’ GDP growth rate, % (2021) [22]; (c) APEC member economies’ inflation rate, % (2021) [23]; (d) APEC member economies’ unemployment rate, % (2021) [24]; (e) APEC member economies’ trade balance, USD million (2020) [25]; (f). APEC member economies’ trade openness, % (2018) [26]
Source: own elaboration on the basis of [20–26].
3.3. The Impact of the COVID-19 Pandemic on Supply Chains in the APEC Region
The COVID-19 pandemic has negatively affected supply chains in the APEC region.
Although COVID-19 began as a health crisis, taking into account the restrictions that had to be introduced in the economy, it also became an economic one. The closure of international and internal borders has affected the world economy in the most negative way, primarily due to tourist flows reduction and production stagnation [27–30] (Zakharev, 2021; Kostin, Khomchenko, 2020; Makarov, Drobot, Avtsinova, 2020; Osama, Mun, Fatma, 2020).
In the post-pandemic period, not only economic recovery will be required, but also the containment of the virus spread through measures such as safe distancing, the search for a vaccine and universal vaccination. And given that the problems in the healthcare sector remain unresolved, the economic consequences are likely to intensify even more.
Amid growing trade tensions and declining global demand as a result of structural changes, COVID-19 has led to mass unemployment and further reduced consumer demand for goods and services. According to the IMF, due to COVID-19, in 2020 world GDP decreased by 4.3% [31]; for comparison, during the global financial crisis in 2009, world GDP decreased by 1.7% [32]. According to the UN, a moderate recovery of the global economy in 2021 at the level of 4.7% will hardly compensate for the losses of 2020 [33]. Global trade declined by about 7.6% in 2020 amid massive disruptions in global supply chains and tourist flows [33].
Meanwhile, according to estimates of the Asian Development Bank (hereinafter ADB), the global economic costs of the COVID-19 pandemic may range from 5.8 to 8.8 USD trillion, or 6.4–9.7% of global GDP, without considering policy responses [34]. According to experts, economic losses in the labour market can be estimated at 242 million jobs with lost labour income in the amount of 1.8 USD trillion [7]. In addition, according to the OECD, in 2020 global flows of foreign direct investment (hereinafter FDI) decreased by 38% from the level of 2019, amounting to 846 USD billion, which is the lowest level in 15 years [35].
COVID-19 is an unexpected exogenous event that caused a global economic crisis in the supply and demand market as a result of lockdown, shutdown of production lines in large production centers, increased uncertainty and unemployment.
The impact of the pandemic and the economic crisis on the supply chains caused a ripple effect, since various sectors of the economy were recession-hit, such as the automotive industry, textile industry, electronics, etc. For example, Fiat Chrysler Automobiles had to temporarily stop producing cars in Serbia, as it turned out to be impossible to purchase spare parts in China. Hyundai had to stop production lines in Korea [36].
In addition, COVID-19 and the subsequent crisis affected almost all the economies of the world, unlike the global financial crisis of 2008–2009, the impact of which was largely limited to only a few markets, especially those that were overly influenced by the US financial markets. Thus, although the crisis of 2008–2009 eventually led to a global recession that affected many countries, some large economies were able to maintain stability in general during the crisis. For example, from the point of view of trade, the crisis of 2008–2009 affected the economies of the APEC region in different ways. In 2009, Russia’s foreign trade turnover decreased by 36.2%, Japan – by 26%, and Vietnam – by 9% only [8].
Although emerging markets and developing countries remained relatively unscathed during the global financial crisis of 2008–2009, demonstrating positive real GDP growth rates, in the case of the current pandemic, this is unlikely to be the case [37].
This is especially important given that most economies continue to struggle with the spread of COVID-19.
If we analyze the impact of the COVID-19 pandemic on APEC member economies, we can see that the most affected country is the United States with more than 47 million cases. Russia ranks second in terms of the number of infected in the APEC region (more than 8.7 million people) (Table 2, Figure 4).
Table 2
Statistics on the spread of COVID-19 in APEC member economies (November 5, 2021)
|
APEC Member Economies
|
Total Cases
|
Cases Per 1M Population
|
Total Deaths
|
Deaths Per 1M Population
|
Total Recovered
|
Population
| |||||
|
Australia
|
177,393
|
6,850
|
1,795
|
69
|
153,057
|
25,896,551
| |||||
|
Brunei
Darussalam
|
13,545
|
30,569
|
91
|
205
|
12,098
|
443,096
| |||||
|
Canada
|
1,725,151
|
45,178
|
29,115
|
762
|
1,672,874
|
38,185,960
| |||||
|
Indonesia
|
4,247,320
|
15311
|
143,519
|
517
|
4,092,586
|
277,401,845
| |||||
|
Japan
|
1,723,599
|
13,684
|
18,296
|
145
|
1,701,666
|
125,956,650
| |||||
|
Republic
of Korea
|
375,464
|
7,315
|
2,936
|
57
|
336,548
|
51,328,405
| |||||
|
Malaysia
|
2,492,343
|
75,705
|
29,155
|
886
|
2,396,244
|
32,921,883
| |||||
|
New
Zealand
|
7,138
|
1,427
|
29
|
6
|
4,773
|
5,002,100
| |||||
|
Philippines
|
2,797,986
|
25,086
|
44,085
|
395
|
2,716,524
|
111,536,063
| |||||
|
Singapore
|
210,978
|
35,686
|
78
|
459
|
181,595
|
5,912,055
| |||||
|
Thailand
|
1,951,572
|
27,866
|
19,542
|
279
|
1,834,730
|
70,035,021
| |||||
|
USA
|
47,187,256
|
141,446
|
772,315
|
2,315
|
37,194,111
|
333,606,597
| |||||
|
Chinese
Taipei
|
16,437
|
688
|
847
|
35
|
15,489
|
23,874,627
| |||||
|
Hong
Kong SAR, China
|
12,361
|
1,631
|
213
|
28
|
12,035
|
7,578,559
| |||||
|
China
|
97,605
|
68
|
4,636
|
3
|
91,840
|
1,439,323,776
| |||||
|
Mexico
|
3,818,216
|
29,203
|
289,131
|
2,211
|
3,181,631
|
130,749,130
| |||||
|
Papua
New Guinea
|
31,287
|
3,410
|
406
|
44
|
28,354
|
9,174,025
| |||||
|
Chile
|
1,701,316
|
87,986
|
37,794
|
1,955
|
1,619,955
|
19,336,276
| |||||
|
Peru
|
2,204,424
|
65,632
|
200,350
|
5,965
|
NA
|
33,587,458
| |||||
|
Russia
|
8,714,595
|
59,681
|
244,447
|
1,674
|
7,505,971
|
146,018,452
| |||||
|
Vietnam
|
946,043
|
9,603
|
22,342
|
227
|
835,406
|
98,513,139
| |||||
|
APEC,
total
|
80,452,029
|
26,939
|
1,861,122
|
623
|
8,341,377
|
2,986,381,668
| |||||
|
World,
total
|
249,506,207
|
31,564
|
5,048,489
|
638
|
225,957,907
|
7,904,641,410
| |||||
Figure 4 shows 11 APEC member economies with more than 47 million COVID-19 cases. The USA is far ahead with more than 47 million confirmed cases of COVID-19. Russia is the second with more than 8 million COVID-19 cases. Indonesia is the third with more than 4 million COVID-19 cases. The top three in terms of the number of COVID-19 cases per million population are the USA (141,446), Chile (87,986) and Malaysia (75,705).
In terms of the total number of deaths from COVID-19, the United States (772,315), Mexico (289,131) and Russia (244,447) are leading; and in terms of the number of deaths per million population, Peru (5,965), the United States (2,315) and Mexico (2,211) are ahead.
The lowest number of COVID-19 cases per million population is observed in China (68), Chinese Taipei (688) and New Zealand (1,427). The lowest number of deaths from COVID-19 per million population is revealed in China (3), New Zealand (6) and Australia (69). The low mortality rate in these countries can be explained by strict government measures and residents’ responsibility.
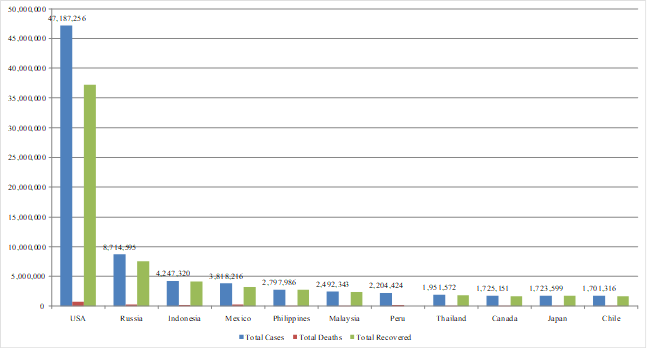
Figure 4. Statistics on the COVID-19 spread in 13 APEC member economies with the maximum number of morbidity and deaths (November 5, 2021)
Source: own elaboration on the basis of [38].
The COVID-19 pandemic has had a significant negative impact on foreign trade flows. The volume of exports and imports began to decline from the beginning of 2019. The sharpest drop was noted in April 2020, when the volume of exports and imports decreased by about 12.2% and 13.5% at an annual rate, respectively (Fig. 5).
By the end of 2020, world trade declined by about 7.6% amid disruptions in global supply chains [33]. Nevertheless, in 2021, economic activity began to recover and trade in goods on world markets exceeded the pre-pandemic level. According to WTO experts, the volume of world trade in goods in 2021 will grow by 10.8%, whereas the previous forecast was 8% only [39]. In 2022 the world trade will continue to grow at about 4.7% [40].
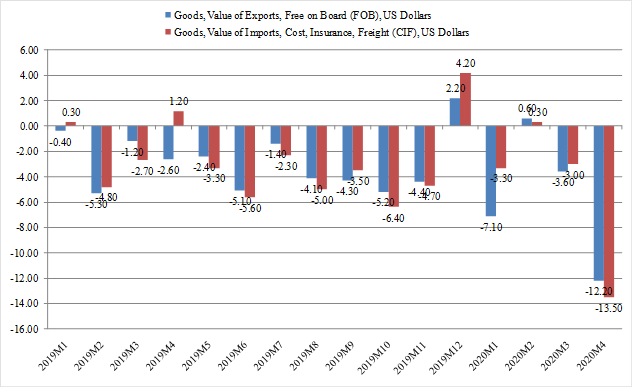
Figure 5. Annual changes in exports and imports in the Asia-Pacific region
Source: International Monetary Fund - Direction of Trade Statistics; Chinese Taipei's Ministry of Finance – Trade. Statistics Database; APEC Policy Support Unit calculations (preliminary).
Global trade growth should slow down as commodity trade approaches its long-term trend before the pandemic. The greatest risks are as follows: the spread of new coronavirus strains, the shortage of semiconductors and the load on ports that cannot cope with the volume of orders. These challenges may create additional pressure on the supply chains, but should not have a global impact.
Concerning the APEC region, the total GDP of the APEC member economies decreased by 2.5% in 2020, and production losses amounted to about 1.8 USD trillion due to the negative economic impact of COVID-19. The APEC region’s economy is expected to recover by 5.2% in 2021 [41] (Hernando, 2020).
While the assessment of overall trade performance offers insight into the overall impact on value chains, it does not provide much detailed information. Most of the problems associated with measuring the GVCs impact are related to the fact that the traditional approach to valuation often quantifies the transactions gross value, rather than the value of each individual transaction in the GVC [42].
For example, while imports of goods and services are often measured by country, the types of transactions, as well as whether these goods are intermediate or final ones, are often not tracked, probably because it is burdensome. In addition, data are usually prepared annually, which makes it difficult to assess the impact of an event on global value chains.
Another problem worth noting is that the crisis provoked by the COVID-19 pandemic is still ongoing, and this, in turn, makes it difficult to understand the full extent of its impact on global value chains.
The assessment could be based on indicators of the GVC participation. When value chains are less connected to each other, a crisis in one economy is unlikely to have the same strong impact on the other, which reduces the impact on global trade as a whole. Conversely, when the value chains are interconnected strongly enough, the consequences of GVC failures can be transmitted faster, easier and influence more participants.
However, it does not follow from this that GVCs are not profitable for trade. One of their main advantages is the ability to quickly rebuild supply chains and switch to other suppliers in case of failures. But it is worth noting that it is often difficult to do this in a short period of time, for example, when there is a systemic risk, i.e. an unexpected crisis, such as COVID-19, which affects a large number of economies
4. Discussion
It should also be noted that amid the global crisis caused by the pandemic, GVC sustainability factors are of particular importance. Taking into account that the impact of COVID-19 on global trade and GVCs is extremely significant, it is more important than ever that economies continue to improve the sustainability of their supply chains.
From our point of view, the term “global value chain sustainability” reflects the importance of countering global risks in an unstable external environment.
Schematically, the GVC sustainability model, as we called it “The GVC Sustainability Star”, is presented in Figure 6.
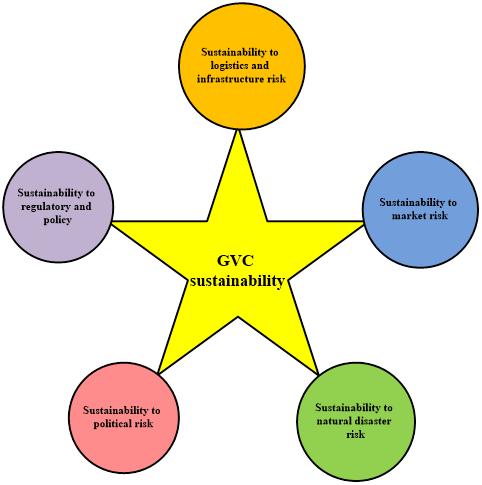
Figure 6. The GVC Sustainability Star
Source: own elaboration on the basis of [7] (Sangaraju, Bayhaqi, 2020).
The GVC Sustainability Star consists of five elements:
1. Sustainability to logistics and infrastructure risk. To ensure this type of GVC sustainability, measures limiting the economic and social disruptions that can occur in the supply chain when markets or entities do not work as expected should be taken;
2. Sustainability to market risk. To ensure this type of GVC sustainability, measures limiting the economic and social consequences of economic oscillations, expressed in prices and production volume fluctuations, etc. should be provided;
3. Sustainability to natural disasters risk. To ensure this type of GVC sustainability, measures limiting the economic and social consequences of natural disasters should be taken;
4. Sustainability to political risks. To ensure this type of GVC sustainability, measures limiting the economic and social consequences of possible difficulties in economic activity as a result of political or violent conflicts inside or outside the economy should be provided;
5. Sustainability to regulatory and policy risks. To ensure this type of GVC sustainability, measures limiting the economic and social perverse effects of unexpected regulatory changes or inconsistencies in law enforcement, which can increase the uncertainty of doing business and, consequently, the GVC transaction costs, should be applied.
Although all five elements of the GVC Sustainability Star (Figure 6) are important for the GVC sustainability as a whole, in our opinion, there are two major ones that are critical due to the COVID-19 pandemic. These are sustainability to natural disaster risk and sustainability to logistics and infrastructure risk.
Sustainability to natural disaster risk. This element of GVC sustainability is particularly important due to the fact that COVID-19 is a healthcare crisis affecting a significant part of the population in the Asia-Pacific region. Several countries in the region have faced a number of challenges in their efforts to contain the pandemic, including a lack of healthcare facilities to deal with the growing number of patients and a shortage of medical staff. To contain the pandemic, Asia-Pacific countries had to impose restrictions, which affected the value chains. Thus, sustainability in the face of disaster risk is important to ensure the rapid recovery of value chains.
Sustainability to logistics and infrastructure risk. Global trade largely depends on efficient logistics operations and developed infrastructure around the world. As value chains in the Asia-Pacific region become fragmented, the functioning of one part of the value chain affects others as well. This is evidenced by the lockdowns introduced all over the world: not only production has stopped, but also logistics channels have faced significant operational problems affecting the production and distribution of final goods around the world. The uneven development of APEC economies affects the region’s ability to recover quickly during a period of systematic failures in the supply chains.
In order to strengthen the APEC GVC’s sustainability to the above-mentioned risks, active state intervention and the adoption of a wide range of measures to overcome the crisis are necessary. Several initiatives have been taken at the APEC level. For example, in the field of logistics and infrastructure, some APEC member economies have focused on speeding up and simplifying customs formalities in order to avoid delays due to border and customs procedures, especially in large ports [43]. These measures can have a significant impact on increasing sustainability to logistics and infrastructure risks.
At the level of individual countries, economies have increased their sustainability to the natural disaster risks by strengthening the healthcare system capacity. For example, Singapore, expecting an increase in the number of patients with COVID-19, has begun to expand the introduction of information and communication technologies in the healthcare sector since April 2020 [44, 45] (Liao, Fan Ziyang, 2020; Min Zhang Lim, 2020). Australia increased health spending by 2.4 USD billion in response to COVID-19 [46].
These are just small examples of a number of efforts being made by APEC member economies to address healthcare challenges in response to the pandemic. From the point of view of sustainability to logistics and infrastructure risks, countries have put forward new initiatives, especially with regard to speeding up and simplifying customs procedures for the movement of medical goods. For example, Singapore and New Zealand signed the Declaration on Trade in Essential Goods for Combating the COVID-19 Pandemic on April 15, 2020 [47]. This Declaration is aimed at keeping open trade channels between the two economies and ensuring uninterrupted supply of medical goods.
The Republic of Korea used its GVC to provide COVID-19 testing kits to economies around the world in a few weeks after the crisis began, transforming and expanding its production [48] (Miroudot, 2020).
In addition to measures aimed at increasing sustainability by addressing the challenges directly related to the pandemic, the APEC Business Advisory Council (hereinafter ABAC) encouraged APEC economies to apply a number of measures to increase sustainability to the indirect impacts of COVID-19 through policies that:
1. Keep markets for goods, services and investments open;
2. Oppose any approach to deglobalization and encourages diversification;
3. Support micro, small and medium-sized enterprises in solving operational tasks;
4. Use digital technologies;
5. Ensure coordination of joint efforts to open borders [49].
Although these actions do not directly increase the GVC sustainability to the natural disaster risks, as well as to logistics and infrastructure ones, they have an impact on other components related to the fight against the pandemic, namely, they affect the sustainability to market, political, regulatory and policy risks.
It should be noted that there is a lack of timely research providing analysis of the relationship between countries’ energy indicators and their participation in the GVCs.
However, several scientific studies of recent years concerning GVC energy efficiency [50–54] (Palekhov, Palekhova, 2018; Bamber, Guinn, Gereffi, 2014; Bhuniya Shaktipada, Pareek Sarla, Sarkar Biswajit, Sett Bimal, 2020; Lim Byeongho, Yoo Jeongho, Hong Kyoungseo, Cheong Inkyo, 2021) and particularities of different energy sources in GVC [55–58] (Morris, Robbins, Hansen, Nygard, 2021; Sarkar Biswajit, Mridha Bablu, Pareek Sarla, Sarkar Mitali, Lakshmi Dr., 2021; Vandana, Singh, Yadav, Sarkar, Sarkar, 2021; Akar, Augustine, Kurup, Mann, 2018) should be mentioned.
In our earlier studies, we have already noted that in order to make their business environment more favorable for economic diversification and GVC modernization, countries should focus on reforming trade policy in order to reduce trade costs and attract foreign direct investment by improving the institutional, regulatory and legal framework and lifting restrictions [29, 59, 60] (Makarov, Drobot, Avtsinova, 2020; Drobot, Makarov, 2021; Drobot, Losinkova, Pospelova, Utyabaeva, Fedash, 2018).
Casella et al. (2019) discuss the relevance of GVC data for the analysis of globalisation patterns, particularly at the intersection between trade, investment and development [61] (Casella, Bolwijn, Mora, Kanemoto, 2019). Morris et al. (2021) note that GVC management depends on the dynamics of system integration [55] (Morris, Robbins, Hansen, Nygard, 2021). Thus, the leading firms in each country and integration association work as system integrators.
At the same time, special importance should be given to the development of energy and industrial policy, within the framework of which it is necessary to provide opportunities for localization of domestic and foreign enterprises operating in the energy sector, as well as their interaction.
In addition, countries and integration associations should consider the development and implementation of renewable energy sources as a green economy strategy within the framework of their industrial policy as priority areas for the development of energy GVC.
Considering the foregoing, further research may be related to the study of the place of renewable energy sources in GVC, taking into account green economy strategies.
5. Conclusions
Despite the progress made within global supply chains, the COVID-19 pandemic has identified areas with low resilience. Globally, according to OECD experts, the pandemic has shown that economies around the world need to ensure the availability of a significant amount of resources in case of unforeseen events, since due to the COVID-19 pandemic, some countries are experiencing difficulties in providing medical staff and the population with equipment and means of protection, such as masks, ventilators and tests [62]. In particular, APEC faces certain gaps in comparison with other regional economic organizations and associations. These are, for example, the uneven level of development of the participating economies, low resistance to logistics and infrastructure risks. Given that the economies of the APEC region are interdependent, especially in terms of trade and global value chains, jointly improving the sustainability of the region is especially important.
In particular, APEC faces certain gaps in comparison with other regional economic organizations and associations. These are, for example, uneven development of the participating economies and low resistance to logistics and infrastructure risks. Taking into account that APEC member economies are interdependent, especially in terms of trade and global value chains, it is especially important to provide joint sustainability improvement in the region.
Therefore, it is necessary to make concerted efforts of APEC economies aimed at increasing the GVCs sustainability to natural disaster, logistics and infrastructure risks, as well as developing unified energy policy standards.
Источники:
2. Porter M. Competitive Advantage: Creating and Sustaining Superior Performance. - New York: The Free Press, 1985. – 592 p.
3. Porter M. Competitive strategy: Techniques for analyzing Industries and Competitors. - Moscow: Alpina Publisher, 2011. – 454 p.
4. Building Resilience in Supply Chains. Geneva: WEF, 2013. [Электронный ресурс]. URL: http://www3.weforum.org/docs/WEF_RRN_MO_BuildingResilienceSupplyChains_Report_2013.pdf (дата обращения: 05.12.2021).
5. A New Metric for Measuring Supply Chain Resiliency: An Introduction to Resilinc R ScoreTM and Its Application to the High-Tech Industry Supply Chain. Resilinc and Global Supply Chain Resiliency Council, 2017. [Электронный ресурс]. URL: https://info.resilinc.com/hubfs/R%20Score%20Whitepaper%20March%202017_Latest%20.pdf (дата обращения: 05.12.2021).
6. ISO 28002:2011 “Security management systems for the supply chain – Development of resilience in the supply chain – Requirements with guidance for use”. Publication date: 2011-08. International Organization of Standardization. [Электронный ресурс]. URL: https://www.iso.org/standard/56087.html (дата обращения: 26.12.2021).
7. Sangaraju D., Bayhaqi A. Managing Risks in Global Value Chains: Streng-thening Resilience in the APEC Region. APEC Secretariat, APEC Policy Support Unit, 2020. [Электронный ресурс]. URL: https://www.apec.org/Publications/2020/12/Managing-Risks-in-Global-Value-Chains (дата обращения: 05.12.2021).
8. Quantitative Analysis of Value Chain Strength in the APEC Region. Singa-pore: APEC Policy Support Unit, 2014. [Электронный ресурс]. URL: http://publications.apec.org/-/media/APEC/Publications/2014/10/Quantitative-Analysis-of-Value-Chain-Strength-in-the-APEC-Region/VC-Strength-Draft-Report-v6.pdf (дата обращения: 05.12.2021).
9. Kaufman G.G., Scott K.E. What Is Systemic Risk, and Do Bank Regulators Retard or Contribute to It? // The Independent Review. – 2003. – № 7(3). – p. 371–391.
10. Global Risks 2014. Geneva: World Economic Forum, 2014. [Электронный ресурс]. URL: https://www3.weforum.org/docs/WEF_GlobalRisks_Report_2014.pdf (дата обращения: 29.12.2021).
11. New Models for Addressing Supply Chain and Transport Risk. Geneva: WEF, 2012. [Электронный ресурс]. URL: https://www3.weforum.org/docs/WEF_SCT_RRN_NewModelsAddressingSupplyChainTransportRisk_IndustryAgenda_2012.pdf (дата обращения: 29.12.2021).
12. McCarthy S. Coronavirus Could Cause Global Medicine Shortages as China’s Factory Closures Hit Supply Chains. South China Morning Post, 4 March 2020. [Электронный ресурс]. URL: https://www.scmp.com/news/china/society/article/3064989/coronavirus-could-cause-global-medicine-shortages-chinas-factory (дата обращения: 05.12.2021).
13. Рыбалко М. Л. Проблема коллективного действия при создании интеграционных объединений южной части Тихого океана. / Австралия и Океания: история, культура, политика, экономика : Коллективная монография / Гл. редактор Я.О. Захарьев. - Москва : Общество с ограниченной ответственностью \\, 2021. – 110-120 c.
14. Дробот Е.В. Cравнительный анализ национальной конкурентоспособности независимых государств Южно-Тихоокеанского региона. / Австралия и Океания: история, культура, политика, экономика : Коллективная монография / Гл. редактор Я.О. Захарьев. - Москва : Общество с ограниченной ответственностью \\\\\\\\, 2021. – 46-77 c.
15. Drobot E.V. Comparative analysis of the international competitiveness of the region (on the example of independent states of the South Pacific region) // Экономические отношения. – 2020. – № 2. – p. 279-306. – doi: 10.18334/eo.10.2.104254.
16. Asia-Pacific Economic Cooperation. Dossier. TASS. APEC Summit, November 17, 2016. [Электронный ресурс]. URL: https://tass.ru/info/2446146 (дата обращения: 05.11.2021).
17. Lupan A. Asia-Pacific Economic Cooperation. / In The Political Economy of Integration. - Prague, 2014.
18. New World Bank country classifications by income level: 2021–2022. [Электронный ресурс]. URL: https://blogs.worldbank.org/opendata/new-world-bank-country-classifications-income-level-2021-2022 (дата обращения: 12.12.2021).
19. World Economic Outlook Database; International Monetary Fund, 2021. [Электронный ресурс]. URL: https://www.imf.org/ (дата обращения: 05.12.2021).
20. Gross National Income per Capita 2021. World Bank, 2021. [Электронный ресурс]. URL: data.worldbank.org (дата обращения: 06.12.2021).
21. National Debt to GDP Ratio. [Электронный ресурс]. URL: https://ru.tradingeconomics.com/country-list/government-debt-to-gdp (дата обращения: 05.12.2021).
22. GDP Growth Rates. Trading Economics, 2021. [Электронный ресурс]. URL: https://ru.tradingeconomics.com/country-list/gdp-annual-growth-rate (дата обращения: 05.12.2021).
23. Inflation Rate. [Электронный ресурс]. URL: https://ru.tradingeconomics.com/country-list/inflation-rate (дата обращения: 05.12.2021).
24. Unemployment Rate. [Электронный ресурс]. URL: https://ru.tradingeconomics.com/country-list/unemployment-rate (дата обращения: 05.12.2021).
25. Trade Balance. [Электронный ресурс]. URL: https://ru.theglobaleconomy.com/rankings/trade_balance_dollars/ (дата обращения: 05.12.2021).
26. Trade Openness. [Электронный ресурс]. URL: https://ru.theglobaleconomy.com/rankings/trade_openness/ (дата обращения: 05.12.2021).
27. Захарьев Я. О. Пандемия вируса COVID-19 в Южно-Тихоокеанском регионе в 2020-2021 гг. / Австралия и Океания: история, культура, политика, экономика : Коллективная монография / Гл. редактор Я.О. Захарьев. - Москва : Общество с ограниченной ответственностью \\\\, 2021. – 143-149 c.
28. Костин К.Б., Хомченко Е.А. Влияние пандемии COVID-19 на мировую экономику // Экономические отношения. – 2020. – № 4. – c. 961-980. – doi: 10.18334/eo.10.4.111372.
29. Макаров И.Н., Дробот Е.В., Авцинова А.А. Пандемия и экономическая безопасность регионов: логистика в условиях ограничений // Экономические отношения. – 2020. – № 4. – c. 1387-1404. – doi: 10.18334/eo.10.4.111306.
30. Osama A., Mun D.V., Fatma D. Responding to the COVID-19 pandemic: economics and health of economically developed and developing countries // Journal of international economic affairs. – 2020. – № 10(4). – p. 981–998. – doi: 10.18334/eo.10.4.111083.
31. World Economic Outlook: A Long and Difficult Ascent. Washington, DC: International Monetary Fund, October 2020. [Электронный ресурс]. URL: https://www.imf.org/en/Publications/WEO/Issues/2020/09/30/world-economic-outlook-october-2020 (дата обращения: 29.12.2021).
32. Covid-19: Disrupting Lives, Economies and Societies. Monthly Briefing on the World Economic Situation and Prospects. United Nations Department of Social and Economic Affairs, February 2020. [Электронный ресурс]. URL: www.un.org (дата обращения: 05.12.2021).
33. World GDP Decreased by 4.3% due to the Pandemic. Rambler, January 25, 2021. [Электронный ресурс]. URL: https://news.rambler.ru/world/45676808/?utm_content=news_media&utm_medium=read_more&utm_source=copylink (дата обращения: 05.12.2021).
34. An Updated Assessment of the Economic Impact of COVID-19. ADB Briefs no. 133, Manila: ADB, 2020. [Электронный ресурс]. URL: https://www.adb.org/sites/default/files/publication/604206/adb-brief-133-updated-economic-impact-covid-19.pdf (дата обращения: 05.12.2021).
35. Foreign Direct Investment in the World in 2020 Fell to the Lowest in 15 Years. Interfax, May 4, 2021. [Электронный ресурс]. URL: https://www.interfax.ru/business/764560 (дата обращения: 05.12.2021).
36. Coronavirus Exposes Cracks in Carmakers’ Chinese Supply Chains. New York Times. Straits Times, 5 February 2020. [Электронный ресурс]. URL: https://www.straitstimes.com/business/companies-markets/coronavirus-exposes-cracks-in-carmakers-chinese-supply-chains (дата обращения: 05.12.2021).
37. Gita Gopinath on the Great Lockdown, and how has COVID changed our view of risk: this week's World Vs Virus podcast. WEF, 21 May 2020. [Электронный ресурс]. URL: https://www.weforum.org/agenda/2020/05/imf-chief-economist-gita-gopinath-episode-10-world-vs-virus-podcast/ (дата обращения: 05.12.2021).
38. Worldometers. [Электронный ресурс]. URL: https://www.worldometers.info/coronavirus/ (дата обращения: 05.11.2021).
39. Trade Shows Signs of Rebound from COVID-19, Recovery Still Uncertain. World Trade Organization (WTO). [Электронный ресурс]. URL: https://www.wto.org/english/news_e/pres20_e/pr862_e.htm (дата обращения: 05.11.2021).
40. The World Economy Was Predicted to Recover. Lenta.ru. Economy, October 4, 2021. [Электронный ресурс]. URL: https://lenta.ru/news/2021/10/04/worldgrowth/ (дата обращения: 05.11.2021).
41. Hernando R.C. APEC amid COVID-19: Navigating Risks and Opportunities toward Resilience. / In APEC Regional Trends Analysis. - Singapore: APEC, 2020.
42. Global Value Chain Development Report 2017: Measuring and Analyzing the Impact of GVCs on Economic Development. Washington, DC: World Bank, 2017. [Электронный ресурс]. URL: https://www.brookings.edu/wp-content/uploads/2017/07/tcgp-17-01-china-gvcs-complete-for-web-0707.pdf (дата обращения: 05.11.2021).
43. Trade Facilitation Is Critical Response to COVID-19 Pandemic: APEC CTI. Antaranews.com, 18 June 2020. [Электронный ресурс]. URL: https://en.antaranews.com/news/150992/trade-facilitation-is-critical-response-to-covid-19-pandemic-apec-cti (дата обращения: 05.11.2021).
44. Liao R., Fan Ziyang Supply Chains Have Been Upended. Here’s How to Make Them More Resilient. World Economic Forum, 6 April 2020. [Электронный ресурс]. URL: https://www.weforum.org/agenda/2020/04/supply-chains-resilient-covid-19/ (дата обращения: 05.11.2021).
45. Min Zhang Lim Coronavirus: Hospitals Expanding ICU Capacity in Anticipation of Needs. The Straits Times, 29 April 2020. [Электронный ресурс]. URL: https://www.straitstimes.com/singapore/hospitals-expanding-icu-capacity-in-anticipation-of-needs (дата обращения: 28.12.2021).
46. $2.4 Billion Health Plan to Fight COVID-19. Media release, Prime Minister of Australia, 11 March 2020. [Электронный ресурс]. URL: https://www.pm.gov.au/media/24-billion-health-plan-fight-covid-19 (дата обращения: 05.11.2021).
47. Declaration on Trade in Essential Goods for Combating the COVID-19 Pandemic. [Электронный ресурс]. URL: https://www.beehive.govt.nz/sites/default/files/2020-04/FINAL%20TEXT%20Declaration%20on%20Trade%20in%20Essential%20Goods.pdf (дата обращения: 05.11.2021).
48. Miroudot S. Resilience versus Robustness in Global Value Chains: Some Policy Implications. VoxEU and CEPR, 18 June 2020. [Электронный ресурс]. URL: https://voxeu.org/article/resilience-versus-robustness-global-value-chains (дата обращения: 05.11.2021).
49. ABAC COVID-19 Report: Laying the Groundwork for Economic Recovery and Resilience. 2020/ESOM2/002. Singapore: APEC, 2020. [Электронный ресурс]. URL: http://mddb.apec.org/Documents/2020/SOM/ESOM2/20_esom2_002.pdf (дата обращения: 05.11.2021).
50. Palekhov D., Palekhovа L. Methodical approaches to increasing the energy efficiency of global value chains. - Naukovyi Visnyk Natsionalnoho Hirnychoho Universytetu, 2018.
51. Energy and Global Production Networks. / In book: The Palgrave Handbook of the International Political Economy of Energy; Van de Graaf, T.; Sovacool, B.K.; Ghosh, A.; Kern, F.; Klare, M.T. (Eds.). - Palgrave Macmillan, 2016.
52. Bamber P., Guinn A., Gereffi G. Burundi in the Energy Global Value Chain: Skills of Private Sector Development. Technical Report. - CGGC Duke University, NC, 2014.
53. Bhuniya Shaktipada, Pareek Sarla, Sarkar Biswajit, Sett Bimal A Smart Production Process for the Optimum Energy Consumption with Maintenance Policy under a Supply Chain Management // Processes. – 2020. – № 9(19). – doi: 10.3390/pr9010019.
54. Lim Byeongho, Yoo Jeongho, Hong Kyoungseo, Cheong Inkyo Impacts of Reverse Global Value Chain (GVC) Factors on Global Trade and Energy Market // Energies. – 2021. – № 14. – p. 3417. – doi: 10.3390/en14123417.
55. Morris M., Robbins G., Hansen U.E., Nygard I. The wind energy global value chain localisation and industrial policy failure in South Africa // Journal of International Business Policy. – 2021. – doi: 10.1057/s42214-021-00123-8.
56. Sarkar Biswajit, Mridha Bablu, Pareek Sarla, Sarkar Mitali, Lakshmi Dr. A flexible biofuel and bioenergy production system with transportation disruption under a sustainable supply chain network // Journal of Cleaner Production. – 2021. – № 317. – p. 128079. – doi: 10.1016/j.jclepro.2021.128079.
57. Vandana, Singh S. R., Yadav D., Sarkar B., Sarkar M. Impact of energy and carbon emission of a supply chain management with two-level trade-credit policy // Energies. – 2021. – № 14(6). – p. 1569. – doi: 10.3390/en14061569.
58. Akar S., Augustine C., Kurup P., Mann M. Global Value Chain and Manufacturing Analysis on Geothermal Power Plant Turbines. / National Renewable Energy Laboratory Technical Report NREL/TP-6A20-71128., 2018.
59. Дробот Е.В., Макаров И.Н. Россия в глобальной цепочке создания стоимости: эффективность и угрозы экономической безопасности в контексте COVID-19 // Экономическая безопасность. – 2021. – № 4(3). – c. 589–606. – doi: 10.18334/ecsec.4.3.111950.
60. Дробот Е.В., Лосинкова В.А., Поспелова А.Л., Утябаева Э.Р., Федаш К.А. Обзор ключевых подходов к классификации стран мира и сравнительный анализ основных макроэкономических показателей ведущих мировых экономик // Экономические отношения. – 2018. – № 2. – c. 105-138. – doi: 10.18334/eo.8.2.39014.
61. Casella B., Bolwijn R., Mora D., Kanemoto K. Improving the Analysis of Global Value Chains: The UNCTAD-Eora Database // Transnational Corporations. – 2019. – № 26(3).
62. A Systemic Resilience Approach to Dealing with Covid-19 and Future Shocks. Oecd, 2020. [Электронный ресурс]. URL: https://read.oecd-ilibrary.org/view/?ref=131_131917-kpfefrdfnx&title=A-Systemic-Resilience-Approach-to-dealing-with-Covid-19-and-future-shocks (дата обращения: 05.11.2021).
Страница обновлена: 10.07.2026 в 17:15:48
Download PDF | Downloads: 92 | Citations: 6
Risk management in GVCs amidst the COVID-19 pandemic
Drobot E.V.Journal paper
Economic security
Volume 5, Number 1 (January-March 2022)
Abstract:
Amidst the COVID-19 pandemic, global value chains are under threat. Thus, the analysis of the pandemic impact on GVCs is important. Based on the analysis of the APEC main economic indicators, the COVID-19 pandemic impact on the supply chains in the region was assessed. The concept of GVC Sustainability Star is presented, which helps to concretize and counteract the GVC sustainability risks. It was concluded that amidst the pandemic crisis and its consequences, concerted efforts of APEC member economies are needed to increase GVC sustainability and develop unified energy policy standards.
ACKNOWLEDGMENTS: The article was prepared in the framework of participation in the International Scientific and Practical Conference “The 6th Senchagov Readings” on the topic: “Russia's Economic Security in the New Reality”, Moscow: Institute of Economics, Russian Academy of Sciences, March 30–31, 2022.
Keywords: APEC, global value chain, pandemic, risk management, sustainability
Funding:
JEL-classification: F02, F14, F15, F63, F52
References:
$2.4 Billion Health Plan to Fight COVID-19Media release, Prime Minister of Australia, 11 March 2020. Retrieved November 05, 2021, from https://www.pm.gov.au/media/24-billion-health-plan-fight-covid-19
Energy and Global Production Networks (2016).
A New Metric for Measuring Supply Chain Resiliency: An Introduction to Resilinc R ScoreTM and Its Application to the High-Tech Industry Supply ChainResilinc and Global Supply Chain Resiliency Council, 2017. Retrieved December 05, 2021, from https://info.resilinc.com/hubfs/R%20Score%20Whitepaper%20March%202017_Latest%20.pdf
A Systemic Resilience Approach to Dealing with Covid-19 and Future ShocksOecd, 2020. Retrieved November 05, 2021, from https://read.oecd-ilibrary.org/view/?ref=131_131917-kpfefrdfnx&title=A-Systemic-Resilience-Approach-to-dealing-with-Covid-19-and-future-shocks
ABAC COVID-19 Report: Laying the Groundwork for Economic Recovery and Resilience. 2020/ESOM2/002Singapore: APEC, 2020. Retrieved November 05, 2021, from http://mddb.apec.org/Documents/2020/SOM/ESOM2/20_esom2_002.pdf
Akar S., Augustine C., Kurup P., Mann M. (2018). Global Value Chain and Manufacturing Analysis on Geothermal Power Plant Turbines
An Updated Assessment of the Economic Impact of COVID-19ADB Briefs no. 133, Manila: ADB, 2020. Retrieved December 05, 2021, from https://www.adb.org/sites/default/files/publication/604206/adb-brief-133-updated-economic-impact-covid-19.pdf
Asia-Pacific Economic Cooperation. Dossier. TASS. APEC Summit, November 17, 2016. Retrieved November 05, 2021, from https://tass.ru/info/2446146
Bamber P., Guinn A., Gereffi G. (2014). Burundi in the Energy Global Value Chain: Skills of Private Sector Development. Technical Report
Bhuniya Shaktipada, Pareek Sarla, Sarkar Biswajit, Sett Bimal (2020). A Smart Production Process for the Optimum Energy Consumption with Maintenance Policy under a Supply Chain Management Processes. (9(19)). doi: 10.3390/pr9010019.
Building Resilience in Supply ChainsGeneva: WEF, 2013. Retrieved December 05, 2021, from http://www3.weforum.org/docs/WEF_RRN_MO_BuildingResilienceSupplyChains_Report_2013.pdf
Casella B., Bolwijn R., Mora D., Kanemoto K. (2019). Improving the Analysis of Global Value Chains: The UNCTAD-Eora Database Transnational Corporations. (26(3)).
Coronavirus Exposes Cracks in Carmakers’ Chinese Supply Chains. New York Times. Straits Times, 5 February 2020. Retrieved December 05, 2021, from https://www.straitstimes.com/business/companies-markets/coronavirus-exposes-cracks-in-carmakers-chinese-supply-chains
Covid-19: Disrupting Lives, Economies and Societies. Monthly Briefing on the World Economic Situation and ProspectsUnited Nations Department of Social and Economic Affairs, February 2020. Retrieved December 05, 2021, from www.un.org
Declaration on Trade in Essential Goods for Combating the COVID-19 Pandemic. Retrieved November 05, 2021, from https://www.beehive.govt.nz/sites/default/files/2020-04/FINAL%20TEXT%20Declaration%20on%20Trade%20in%20Essential%20Goods.pdf
Drobot E.V. (2020). Comparative analysis of the international competitiveness of the region (on the example of independent states of the South Pacific region) Ekonomicheskie otnosheniya. (2). 279-306. doi: 10.18334/eo.10.2.104254.
Drobot E.V. (2021). Cravnitelnyy analiz natsionalnoy konkurentosposobnosti nezavisimyh gosudarstv Yuzhno-Tikhookeanskogo regiona [South Pacific Region Independent States Competitiveness Analysis] (in Russian).
Drobot E.V., Losinkova V.A., Pospelova A.L., Utyabaeva E.R., Fedash K.A. (2018). Obzor klyuchevyh podkhodov k klassifikatsii stran mira i sravnitelnyy analiz osnovnyh makroekonomicheskikh pokazateley vedushchikh mirovyh ekonomik [Review of key approaches to the classification of the countries of the world and a comparative analysis of the main macroeconomic indicators of the world''s leading economies]. Journal of International Economic Affairs. (2). 105-138. (in Russian). doi: 10.18334/eo.8.2.39014.
Drobot E.V., Makarov I.N. (2021). Rossiya v globalnoy tsepochke sozdaniya stoimosti: effektivnost i ugrozy ekonomicheskoy bezopasnosti v kontekste COVID-19 [Russia in the global value chain: efficiency and threats to economic security in the context of COVID-19]. Ekonomicheskaya bezopasnost. (4(3)). 589–606. (in Russian). doi: 10.18334/ecsec.4.3.111950.
Foreign Direct Investment in the World in 2020 Fell to the Lowest in 15 Years. Interfax, May 4, 2021. Retrieved December 05, 2021, from https://www.interfax.ru/business/764560
GDP Growth Rates. Trading Economics, 2021. Retrieved December 05, 2021, from https://ru.tradingeconomics.com/country-list/gdp-annual-growth-rate
Gita Gopinath on the Great Lockdown, and how has COVID changed our view of risk: this week's World Vs Virus podcastWEF, 21 May 2020. Retrieved December 05, 2021, from https://www.weforum.org/agenda/2020/05/imf-chief-economist-gita-gopinath-episode-10-world-vs-virus-podcast/
Global Risks 2014Geneva: World Economic Forum, 2014. Retrieved December 29, 2021, from https://www3.weforum.org/docs/WEF_GlobalRisks_Report_2014.pdf
Global Value Chain Development Report 2017: Measuring and Analyzing the Impact of GVCs on Economic DevelopmentWashington, DC: World Bank, 2017. Retrieved November 05, 2021, from https://www.brookings.edu/wp-content/uploads/2017/07/tcgp-17-01-china-gvcs-complete-for-web-0707.pdf
Gross National Income per Capita 2021World Bank, 2021. Retrieved December 06, 2021, from data.worldbank.org
Hernando R.C. (2020). APEC amid COVID-19: Navigating Risks and Opportunities toward Resilience
ISO 28002:2011 “Security management systems for the supply chain – Development of resilience in the supply chain – Requirements with guidance for use”. Publication date: 2011-08International Organization of Standardization. Retrieved December 26, 2021, from https://www.iso.org/standard/56087.html
Ignatenko A., Raei F., Mircheva B. Global Value Chains: What Are the Benefits and Why Do Countries Participate?Working paper; IMF, 2019. Retrieved December 5, 2021, from https://www.imf.org/~/media/Files/Publications/WP/2019/wp1918.ashx
Inflation Rate. Retrieved December 05, 2021, from https://ru.tradingeconomics.com/country-list/inflation-rate
Kaufman G.G., Scott K.E. (2003). What Is Systemic Risk, and Do Bank Regulators Retard or Contribute to It? The Independent Review. (7(3)). 371–391.
Kostin K.B., Khomchenko E.A. (2020). Vliyanie pandemii COVID-19 na mirovuyu ekonomiku [Impact of the COVID-19 pandemic on the global economy]. Journal of International Economic Affairs. (4). 961-980. (in Russian). doi: 10.18334/eo.10.4.111372.
Liao R., Fan Ziyang Supply Chains Have Been Upended. Here’s How to Make Them More ResilientWorld Economic Forum, 6 April 2020. Retrieved November 05, 2021, from https://www.weforum.org/agenda/2020/04/supply-chains-resilient-covid-19/
Lim Byeongho, Yoo Jeongho, Hong Kyoungseo, Cheong Inkyo (2021). Impacts of Reverse Global Value Chain (GVC) Factors on Global Trade and Energy Market Energies. (14). 3417. doi: 10.3390/en14123417.
Lupan A. (2014). Asia-Pacific Economic Cooperation
Makarov I.N., Drobot E.V., Avtsinova A.A. (2020). Pandemiya i ekonomicheskaya bezopasnost regionov: logistika v usloviyakh ogranicheniy [Pandemic and economic security of the regions: logistics in terms of restrictions]. Journal of International Economic Affairs. (4). 1387-1404. (in Russian). doi: 10.18334/eo.10.4.111306.
McCarthy S. Coronavirus Could Cause Global Medicine Shortages as China’s Factory Closures Hit Supply ChainsSouth China Morning Post, 4 March 2020. Retrieved December 05, 2021, from https://www.scmp.com/news/china/society/article/3064989/coronavirus-could-cause-global-medicine-shortages-chinas-factory
Min Zhang Lim Coronavirus: Hospitals Expanding ICU Capacity in Anticipation of NeedsThe Straits Times, 29 April 2020. Retrieved December 28, 2021, from https://www.straitstimes.com/singapore/hospitals-expanding-icu-capacity-in-anticipation-of-needs
Miroudot S. Resilience versus Robustness in Global Value Chains: Some Policy ImplicationsVoxEU and CEPR, 18 June 2020. Retrieved November 05, 2021, from https://voxeu.org/article/resilience-versus-robustness-global-value-chains
Morris M., Robbins G., Hansen U.E., Nygard I. (2021). The wind energy global value chain localisation and industrial policy failure in South Africa Journal of International Business Policy. doi: 10.1057/s42214-021-00123-8.
National Debt to GDP Ratio. Retrieved December 05, 2021, from https://ru.tradingeconomics.com/country-list/government-debt-to-gdp
New Models for Addressing Supply Chain and Transport RiskGeneva: WEF, 2012. Retrieved December 29, 2021, from https://www3.weforum.org/docs/WEF_SCT_RRN_NewModelsAddressingSupplyChainTransportRisk_IndustryAgenda_2012.pdf
New World Bank country classifications by income level: 2021–2022. Retrieved December 12, 2021, from https://blogs.worldbank.org/opendata/new-world-bank-country-classifications-income-level-2021-2022
Osama A., Mun D.V., Fatma D. (2020). Responding to the COVID-19 pandemic: economics and health of economically developed and developing countries Journal of international economic affairs. (10(4)). 981–998. doi: 10.18334/eo.10.4.111083.
Palekhov D., Palekhova L. (2018). Methodical approaches to increasing the energy efficiency of global value chains
Porter M. (1985). Competitive Advantage: Creating and Sustaining Superior Performance
Porter M. (2011). Competitive strategy: Techniques for analyzing Industries and Competitors
Quantitative Analysis of Value Chain Strength in the APEC RegionSinga-pore: APEC Policy Support Unit, 2014. Retrieved December 05, 2021, from http://publications.apec.org/-/media/APEC/Publications/2014/10/Quantitative-Analysis-of-Value-Chain-Strength-in-the-APEC-Region/VC-Strength-Draft-Report-v6.pdf
Rybalko M. L. (2021). Problema kollektivnogo deystviya pri sozdanii integratsionnyh obedineniy yuzhnoy chasti Tikhogo okeana [The Issue to Set up South Pacific Ocean States Collective Decisions for Making Integrative Units in the Region] (in Russian).
Sangaraju D., Bayhaqi A. Managing Risks in Global Value Chains: Streng-thening Resilience in the APEC RegionAPEC Secretariat, APEC Policy Support Unit, 2020. Retrieved December 05, 2021, from https://www.apec.org/Publications/2020/12/Managing-Risks-in-Global-Value-Chains
Sarkar Biswajit, Mridha Bablu, Pareek Sarla, Sarkar Mitali, Lakshmi Dr. (2021). A flexible biofuel and bioenergy production system with transportation disruption under a sustainable supply chain network Journal of Cleaner Production. (317). 128079. doi: 10.1016/j.jclepro.2021.128079.
The World Economy Was Predicted to RecoverLenta.ru. Economy, October 4, 2021. Retrieved November 05, 2021, from https://lenta.ru/news/2021/10/04/worldgrowth/
Trade Balance. Retrieved December 05, 2021, from https://ru.theglobaleconomy.com/rankings/trade_balance_dollars/
Trade Facilitation Is Critical Response to COVID-19 Pandemic: APEC CTIAntaranews.com, 18 June 2020. Retrieved November 05, 2021, from https://en.antaranews.com/news/150992/trade-facilitation-is-critical-response-to-covid-19-pandemic-apec-cti
Trade Openness. Retrieved December 05, 2021, from https://ru.theglobaleconomy.com/rankings/trade_openness/
Trade Shows Signs of Rebound from COVID-19, Recovery Still UncertainWorld Trade Organization (WTO). Retrieved November 05, 2021, from https://www.wto.org/english/news_e/pres20_e/pr862_e.htm
Unemployment Rate. Retrieved December 05, 2021, from https://ru.tradingeconomics.com/country-list/unemployment-rate
Vandana, Singh S. R., Yadav D., Sarkar B., Sarkar M. (2021). Impact of energy and carbon emission of a supply chain management with two-level trade-credit policy Energies. (14(6)). 1569. doi: 10.3390/en14061569.
World Economic Outlook Database; International Monetary Fund, 2021. Retrieved December 05, 2021, from https://www.imf.org/
World Economic Outlook: A Long and Difficult AscentWashington, DC: International Monetary Fund, October 2020. Retrieved December 29, 2021, from https://www.imf.org/en/Publications/WEO/Issues/2020/09/30/world-economic-outlook-october-2020
World GDP Decreased by 4.3% due to the PandemicRambler, January 25, 2021. Retrieved December 05, 2021, from https://news.rambler.ru/world/45676808/?utm_content=news_media&utm_medium=read_more&utm_source=copylink
Worldometers. Retrieved November 05, 2021, from https://www.worldometers.info/coronavirus/
Zakharev Ya. O. (2021). Pandemiya virusa COVID-19 v Yuzhno-Tikhookeanskom regione v 2020-2021 gg [The COVID-19 in the South Pacific region in 2020-2021] (in Russian).