Comparative analysis of the international competitiveness of the region (on the example of independent states of the South Pacific region)
Drobot E.V.1,2![]()
1 PRIMEC Publishers, ,
2 Center of Additional Professional Education, ,
Скачать PDF | Загрузок: 91 | Цитирований: 5
Статья в журнале
Экономические отношения (РИНЦ, ВАК)
опубликовать статью | оформить подписку
Том 10, Номер 2 (Апрель-июнь 2020)
Эта статья проиндексирована РИНЦ, см. https://elibrary.ru/item.asp?id=43076847
Цитирований: 5
Аннотация:
The problems of national competitiveness analysis are widely considered in modern publications. However, research and comparative analysis of the national competitiveness of the South Pacific island States remain neglected. In fact, such studies have never been conducted. The purpose of this study is to analyze the international competitiveness of the South Pacific independent States, which allows to determine the factors of their competitive advantage, as well as to assess the possible causes of their competitive weakness. The hypothesis of the study is that the South Pacific independent States, most of which belong to the category of microstates, should have a similar factors of competitive advantage. The official statistics of the UN, the World Bank etc. were used as the initial data. A comparative analysis of national competitiveness of the South Pacific countries is based on the author\\\'s methodology of the integral indicator of national competitiveness. The analysis shows that Australia and New Zealand are two leaders in the region. Fiji and Samoa are leading among the island independent microstates. Papua New Guinea, Vanuatu and Solomon Islands are the outsiders. The main causes of the lag are in inefficient mechanisms of public policy. Common factors of competitive advantages of the South Pacific countries are their geographical isolation, endowment of mineral resources, and openness of the South Pacific. The results of the research will be of interest to the specialists in international relations and competitiveness. Further research may be related to the development of mechanisms to improve the South Pacific competitiveness.
Ключевые слова: analytic hierarchy process, competitive advantage, competitiveness factors, degree of the economy integration into the world economy, factors of competitive advantage, human development index, integral indicator of national competitiveness, life expectancy, national competitiveness, living standard, productivity, South Pacific region
JEL-классификация: O56, O57, F01, F63
Introduction
International competitiveness is an extremely complex and multifaceted phenomenon. The problems of assessment and analyses of the economies’ competitiveness are widely considered in modern both foreign [19–22, 27–33] (Porter, 2011; Porter, 2008; Porter, 1993; Porter, 2006; Chih-Kai Chen, 2013; Delgado, Ketels, Porter, Stern, 2012; Luminita, Bacali, Lungu, 2013; Porter, 2008; Porter, 1985; Porter, 1990; Porter, 1980) and Russian [2–13, 18, 25, 26] (Bogatyreva, Boslovyak, 2018; Bondarenko, 2015; Galimova, Yudina, Livshits, Dunaeva, 2018; Garmashova, 2019; Go, 2019; Drobot, 2012; Drobot, 2004; Drobot, 2016; Drobot, 2015; Drobot, 2012; Drobot, Klevleeva, Kostyleva, 2014; Drobot, Kostyleva, 2017; Mezinova, 2019; Tsikin, 2019;Shkiotov, Markin, Mayorova, 2016) scientific publications.
The most influential modern researcher of competitiveness problems is no doubt Michael Porter [19–22, 28, 30–33] Porter, 2011; Porter, 2008; Porter, 1993; Porter, 2006; Delgado, Ketels, Porter, Stern, 2012; Porter, 2008; Porter, 1985; Porter, 1990; Porter, 1980), who founded the Institute for Strategy and Competitiveness (ISC) in the USA in 2001 [1].
According to the search query “national competitiveness”, we can find 277,658 publications on the portal ELIBRARY.RU, including 611 works published in 2019. Current issues of contemporary competitiveness of such States as the European Union countries [18] (Mezinova, 2019), Russian Federation [12, 26] (Drobot, Klevleeva, Kostyleva, 2014; Shkiotov, Markin, Mayorova, 2016), China [6] (Go, 2019), etc. are discussed in these publications. The particular attention is paid to the concepts and models of national competitiveness [4, 5, 11, 25] (Galimova, Yudina, Livshits, Dunaeva, 2018; Garmashova, 2019; Drobot, 2012; Tsikin, 2019), to the innovation impact on the competitiveness of national economies, as well as to the role of human capital in enhancing the attractiveness and the national competitiveness [2, 3] (Bogatyreva, Boslovyak, 2018; Bondarenko, 2015).
However, research and comparative analysis of the national competitiveness of the South Pacific island States, in fact, have never been conducted.
Among the publications devoted to the problems of the South Pacific region which have been published during the past three years, we can highlight the scientific articles by V.V. Balashov, T.E. Javadov [1] (Balashov, Dzhavadov, 2019), Ya.O. Zakharev [14, 15] (Zakharev, 2019; Zakharev, 2017), I.G. Kostyuchenko [16, 17] (Kostyuchenko, 2017; Kostyuchenko, 2018), A.V. Skripnichenko and S.E. Pale [23] (Skripnichenko, Pale, 2017), A.E. Ulyanina [24] (Ulyanina, 2017), etc.
So, according to the search query “South Pacific region” on the ELIBRARY.RU it is possible to find only 334 publications, and among them it has been only 19 paper works published in 2019.
That is why the study of international competitiveness and factors of competitive advantage of independent States in the South Pacific region is of particular interest (Table 1). It will allow us to determine the factors of competitive advantage of the countries in the South Pacific region, as well as to assess the possible reasons for their competitive weakness. It is also interesting to compare these States with the Russian Federation.
Table 1
Independent States of the South Pacific region
|
№
|
States
|
Date of
independence
|
Date of admission in the UN
|
|
1
|
Australia
|
01.01.1901
|
01.11.1945
|
|
2
|
Vanuatu
|
30.07.1980
|
15.09.1981
|
|
3
|
Kiribati
|
12.07.1979
|
14.09.1999
|
|
4
|
New Zealand
|
26.09.1907
|
24.10.1945
|
|
5
|
Samoa
|
01.10.1962
|
15.12.1976
|
|
6
|
Solomon Islands
|
07.07.1978
|
19.09.1978
|
|
7
|
Tonga
|
04.06.1970
|
14.09.1999
|
|
8
|
Tuvalu
|
01.10.1978
|
05.09.2000
|
|
9
|
Micronesia
|
03.11.1986
|
17.09.1991
|
|
10
|
Fiji
|
10.10.1970
|
13.10.1970
|
|
11
|
Marshall Islands
|
21.10.1986
|
17.09.1991
|
|
12
|
Nauru
|
31.01.1968
|
14.09.1994
|
|
13
|
Niue
|
19.10.1974
|
– [2]
|
|
14
|
Palau
|
01.10.1994
|
15.12.1994
|
|
15
|
Papua New Guinea
|
16.09.1975
|
10.10.1975
|
As a research methodology, we will use the author’s well-settled methodological approach for determination of the integral indicator of national competitiveness, repeatedly used for conduction the comparative analysis of the national competitiveness of Russia and the G-7 countries [8, 10] (Drobot, 2004; Drobot, 2015), as well as of the Eurasian Economic Union countries [13] (Drobot, Kostyleva, 2017).
Also, in our opinion, it is interesting to analyze what places the studied countries occupy in such international rankings as the Global Competitiveness Index of the World Economic Forum (WEF), the annual World Competitiveness Ranking of the Institute Management Development (IMD), and the UN Human Development Index (HDI). Such a study will allow us to get a really comprehensive view of the competitiveness level of the States in the South Pacific region. In addition, it will also be interesting to compare the South Pacific countries with the Russian Federation.
The purpose of our research is to conduct a comparative analysis of the national competitiveness of the independent States in the South Pacific region in order to identify the factors of their competitive advantage.
The object of the study is the economy of the South Pacific independent States. The subject of the study is the competitiveness and factors of competitive advantage of the South Pacific independent States.
The assessment of the national competitiveness and factors of the competitive advantage of the South Pacific countries and Russia will be conducted in this study. Based on the results obtained, we will conduct a comparative analysis of the national competitiveness of the reviewed countries. Then, using data from the Human Development Indices and Indicators report of the United Nations Development Programme (UNDP) for 2018 [3], we will compare the South Pacific countries and Russia in terms of the level of their development.
The scientific novelty of the study is as follows: for the first time on the basis of the author's methodology for determining national competitiveness, a comparative analysis of the factors of competitive advantage of the countries of the South Pacific region is carried out.
Methodology of national competitiveness assessment
In our opinion, when studying the issues of international competitiveness, it is necessary to use a methodology that allows us to determine and quantify the factors of a country's competitive advantage, as well as to conduct a comparative analysis of the national competitiveness of the reviewed economies.
When it comes to the most of the world's countries, as a rule, there are no problems with assessing their competitiveness.
In addition to available, complete and detailed statistical information, there are also two international rankings of countries’ competitiveness: the Global Competitiveness Index of the WEF, which has been published since 2004, and in 2019 it represents data on 141 national economies; the annual World Competitiveness Ranking of the Swiss Institute Management Development (IMD), which has been published since 1996, and the competitiveness factors of 63 national economies are analyzed in its last version of 2019.
It is no doubt that such countries as Australia, New Zealand and Russia are presented in both rankings. In 2019, according to the WEF Global Competitiveness Index, Australia was in 16th position, New Zealand was in 19th position, and Russia was in 43rd position [4]. In the IMD World Competitiveness Ranking for 2019, Australia was the 18th, New Zealand was the 21st, and Russia was the 45th [5].
As for the other countries of the South Pacific region, which are the object of our study, they are not represented in these ratings. The reason is obvious. It is the difficulty of obtaining relevant statistics for this group of countries for the numerous indicators.
We will try to conduct a comparative analysis of the national competitiveness of the countries of the South Pacific region on the basis of available statistical information. And we have tried to collect as accurate data as possible, but the list of indicators is not as extensive as in case of assessing the competitiveness of developed countries.
So, let's move on to the method of determining the integral indicator of national competitiveness.
To start with, we will identify three blocks of national competitiveness factors and for each factor we will determine the optimal indicator set which charts the idea of the level of economic development, economic potential and integration of the national economy into international trade and the country's participation in the international factors movement. In our opinion, the following basic factors and indicators can be used to determine national competitiveness (Fig. 1).
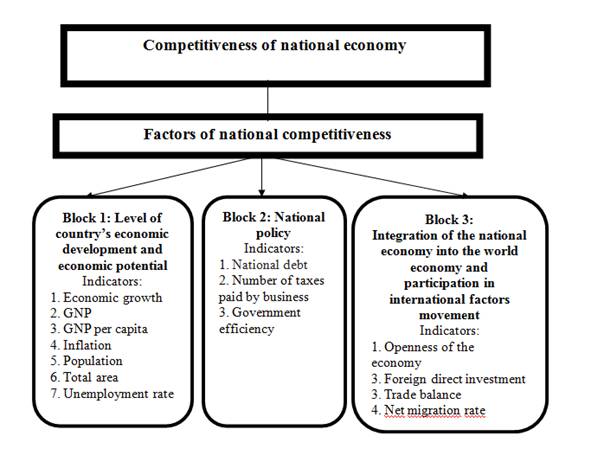
Figure 1. Factors and indicators of national competitiveness
Source: compiled by the author.
When testing the methodology in the next stage, these indicators should be tabulated and weighted. The weight parameters are determined by the analytic hierarchy process [10, p. 136–146] (Drobot, 2015, р. 136–146).
We will assess the country's competitiveness from the standpoint of two criteria – productivity and the living standard [8, 10] (Drobot, 2004; Drobot, 2015).
The structuring of the problem of the national competitiveness is presented in the Figure 2.
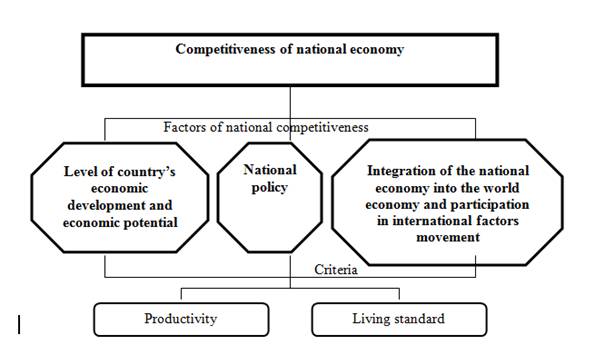
Figure 2. Hierarchical representation of the problem of national competitiveness
Source: compiled by the author.
The next step is to create a matrix of pairwise comparisons of criteria by importance [6].
The results of the comparison of the importance of the criteria are summarized in Table 2.
Table 2
Comparison of criteria by importance
|
Criteria
|
Productivity
|
Living standard
|
Normalized
vector of priorities
|
|
Productivity
|
1
|
3
|
0,75
|
|
Living standard
|
1/3
|
1
|
0,25
|
The criterion of “Productivity” moderately exceeds the “Living standard”, since at the stage of the market economy formation; the efficiency of all types of economic resources is one of the determining factors of economic growth. So, the criterion “Performance” with 0.75 weight rating has the priority in importance. The criterion “Living standard” has a weight equal to 0.25.
At the next stage, matrices of pairwise comparisons of factors for each criterion are made (by analogy with the matrix for criteria) [10, p. 157–160] (Drobot, 2015, р. 157–160). The author has adopted the following gradation of the importance of competitiveness factors according to the “Productivity” criterion: the level of economic development of the country and the resource potential, as well as state policy have the primary influence on the productivity of the national economy. Therefore, we assign these factors a score of 5 and 7 points. By the “Living standard” criterion, the factors the level of economic development and economic potential, integration of national economy into international trade and participation in international factors movement have the maximum ratings, as in modern conditions they provide the well-being of society and quality of life.
The results of the calculations are presented in Tables 3 and 4.
Table 3
Determining the weight of competitiveness factors according to the “Productivity” criterion
|
Productivity
|
Level
of country’s economic development and economic potential
|
National
policy
|
Integration
of the national economy into the world economy and participation in
international factors movement
|
an
|
Normalized vector of priorities
|
|
Level
of country’s economic development and economic potential
|
1
|
1/3
|
5
|
1.186
|
0.245
|
|
National
policy
|
3
|
1
|
7
|
2.759
|
0.570
|
|
Integration
of the national economy into the world economy and participation in
international factors movement
|
5
|
1/7
|
1
|
0.893
|
0.185
|
Table 4
Determining the weight of competitiveness factors by the “Living standard” criterion
|
Living standard
|
Level
of country’s economic development and economic potential
|
National
policy
|
Integration
of the national economy into the world economy and participation in
international factors movement
|
an
|
Normalized vector of priorities
|
|
Level
of country’s economic development and economic potential
|
1
|
7
|
3
|
2.759
|
0.652
|
|
National
policy
|
1/7
|
1
|
1/5
|
0.303
|
0.072
|
|
Integration
of the national economy into the world economy and participation in international
factors movement
|
1/3
|
5
|
1
|
1.17
|
0.276
|
Let's calculate the generalized priority (weight) for each indicator. For this purpose the component value of the vector of priorities of this indicator for the first criterion is multiplied by the priority value of the first criterion, and then the value of the vector of priorities of this indicator according to the second criterion is multiplied by the priority value of the second criterion. The results are summed, and a generalized priority (weight) for each factor is obtained. After that the calculations of the generalized weight for each indicator are made (Table 5).
So, such factors as national policy (1), level of economic development and economic potential (2) and the integration of national economy into international trade and participation in international factors movement (3) have the highest priority and importance in national competitiveness.
Table 5
Generalized priority (weight) of competitiveness factors
|
Competitiveness factors
|
Weight, Wn
|
Priority (rank)
|
|
Level of country’s economic development and economic
potential
|
0.347
|
2
|
|
National policy
|
0.445
|
1
|
|
Integration of the national economy into the world
economy and participation in international factors movement
|
0.208
|
3
|
As soon as the weight and priority of individual indicators have been determined, it is possible to evaluate directly the integrated competitiveness indicator.
In order to calculate the integral indicator of national competitiveness (IC) for the country j, the following formula is proposed:
ICj = CF1j*W1 + CF 2j*W2 + … + CF nj*Wn , (1)
CFnj = ![]() ±
± ![]() ± … ±
± … ± ![]() , (2)
, (2)
IC – an integral indicator of the country's competitiveness;
CFnj – aggregate indicator of competitive advantages (competitiveness factors) of the national economy;
Wn – weight of the factor (Table 5);
Fij – values of the individual indicators i and j in the competitiveness factor CFnj;
j – number of countries;
CF nj*Wn – weighted value of aggregated indicators of the national competitive advantages (competitiveness factors);
± – a plus or minus sign determined by the influence of the indicator on the competitiveness of the country. If the effect of a high value of the indicator is positive, we put the plus sign; and if the effect is negative, we put the minus sign.
The comparative analysis of the national competitiveness of the South Pacific countries and Russia in the world economy
We will conduct a comparative analysis of the competitiveness of the South Pacific countries and Russia. The initial data for the calculations are presented in Table 6. The integral assessment of competitive advantages (competitiveness factors) of the national economies is presented in Table 7.
Table 6
Initial data for determining the national competitiveness of the South Pacific countries and Russia, 2018
|
№
|
National
competitiveness indicators
|
Australia
|
New Zealand
|
Micronesia
|
Solomon Islands
|
Vanuatu
|
Samoa
|
Kiribati
|
Papua New Guinea
|
Tonga
|
Fiji
|
Russia
|
Average value
|
|
1
|
Level of country’s economic development
and economic potential
| ||||||||||||
|
1.1
|
Economic growth (2018), %
|
2.83
|
2.78
|
1.4
|
3.39
|
3.2
|
0.72
|
2
|
0.43
|
0.3
|
5
|
2.25
|
2.2
|
|
1.2
|
GDP (2018), billion US
dollars
|
1432.2
|
205.02
|
0.34
|
1.41
|
0.89
|
0.86
|
0.19
|
23.43
|
0.45
|
5.48
|
1657.55
|
302.529
|
|
1.3
|
GNP per capita
(2018), US
dollars
|
57305.3
|
41966.01
|
3058.43
|
2162.65
|
3033.41
|
4392.47
|
1625.29
|
2711.6
|
4364.02
|
6202.16
|
11288.87
|
12555.47
|
|
1.4
|
Inflation (2018), %
|
1.89
|
1.1
|
-0.3
|
0.98
|
2.39
|
4.92
|
0.6
|
4.6
|
9.78
|
4.58
|
3.48
|
3.09
|
|
1.5
|
Population (2019), million
|
25.526
|
4.94
|
0.114
|
0.67
|
0.3
|
0.197
|
0.118
|
8.776
|
0.104
|
0.89
|
146.78
|
17.12
|
|
1.6
|
Total area, square
kilometres
|
7692024
|
268680
|
702
|
28450
|
12189
|
2935
|
811
|
462 840
|
748
|
18274
|
17125191
|
2328440
|
|
1.7
|
Unemployment
rate (2018), %
|
5.39
|
4.52
|
16.2
|
1.79
|
5.31
|
8.42
|
30.6
|
2.37
|
1.03
|
4.15
|
4.74
|
7.68
|
|
1.8
|
Number of
Internet users (2017), %
|
86.54
|
90.81
|
35.3
|
11.92
|
25.72
|
33.61
|
14.58
|
11.21
|
41.25
|
49.97
|
76.01
|
43.356
|
|
2
|
National policy
| ||||||||||||
|
2.1
|
National debt (2017), % GNP
|
41.6
|
26.4
|
24.5
|
10
|
48.4
|
49.1
|
26.3
|
32.6
|
48
|
46.6
|
17.4
|
33.72
|
|
2.2
|
Number of taxes
paid by business (2018)
|
11
|
7
|
21
|
34
|
31
|
37
|
11
|
39
|
30
|
38
|
9
|
24.36
|
|
2.3
|
Government
efficiency (2018)
|
1.54
|
1.77
|
0.09
|
-1.01
|
-0.9
|
0.62
|
-0.25
|
-0.66
|
-0.22
|
0.09
|
-0.08
|
0.09
|
|
3
|
Integration of the national economy into
the world economy and participation in international factors movement
| ||||||||||||
|
3.1
|
Openness of the
economy (foreign
trade turnover, % GNP in
2018)
|
43
|
52.13
|
99.02
|
98.39
|
99.12
|
76.58
|
112.14
|
131.08
|
89.43
|
77.99
|
51.51
|
84.58
|
|
3.2
|
Foreign direct
investment (2018), billion
US dollars
|
58.05
|
1.47
|
0.0008
|
0.04
|
0.02
|
0.01
|
0
|
-0.18
|
0.02
|
0.34
|
8.82
|
6.235
|
|
3.3
|
Trade balance
(2018), billion
US dollars
|
16.43
|
0
|
-0.11
|
-0.07
|
-0.17
|
-0.13
|
-0.17
|
5.75
|
-0.22
|
-0.45
|
164.51
|
16.85
|
|
3.4
|
Net migration
rate
(2010/2015, per 1,000 population) |
8
|
4
|
-15.8
|
-4.3
|
0
|
-13.4
|
-4
|
0
|
-15.4
|
-6.6
|
1.4
|
-4.19
|
Source: compiled by the author according to Human Development Indices and Indicators. 2018 Statistical Update. United Nations Development Programme, 2018. Retrieved from: http://hdr.undp.org/en/content/human-development-indices-indicators-2018-statistical-update; The World Bank. Retrieved from: https://data.worldbank.org/; TheGlobalEconomy.com. Retrieved from: https://www.theglobaleconomy.com/; NONEWS. Retrieved from: https://nonews.co/directory/lists/countries/ (date of access 10.01.2020).
Table 7
Calculation of the national competitiveness indicators of the South Pacific countries and Russia, 2018
|
№
|
National competitiveness indicators
|
Weight
|
Australia
|
New Zealand
|
Micronesia
|
Solomon Islands
|
Vanuatu
|
Samoa
|
Kiribati
|
Papua New Guinea
|
Tonga
|
Fiji
|
Russia
|
|
1.1
|
Economic growth (2018), %
|
0.347 |
1.28
|
1.263
|
0.636
|
1.54
|
1.455
|
0.327
|
0.909
|
0.195
|
0.136
|
2.272
|
1.023
|
|
1.2
|
GDP (2018), billion US
dollars
|
4.734
|
0.677
|
0.001
|
0.005
|
0.003
|
0.003
|
0.0006
|
0.077
|
0.001
|
0.018
|
5.479
| |
|
1.3
|
GNP per capita
(2018), US
dollars
|
4.564
|
3.342
|
0.243
|
0.172
|
0.241
|
0.35
|
0.129
|
0.216
|
0.347
|
0.493
|
0.899
| |
|
1.4
|
Inflation (2018), %
|
0.611
|
0.356
|
-0.097
|
0.317
|
0.773
|
1.592
|
0.194
|
1.489
|
3.165
|
1.482
|
1.126
| |
|
1.5
|
Population (2019), million
|
1.491
|
0.288
|
0.007
|
0.039
|
0.017
|
0.0115
|
0.007
|
0.512
|
0.006
|
0.052
|
8.573
| |
|
1.6
|
Total area, square
kilometres
|
3.303
|
0.115
|
0.0003
|
0.012
|
0.005
|
0.001
|
0.0003
|
0
|
0.0003
|
0.008
|
7.355
| |
|
1.7
|
Unemployment
rate (2018), %
|
0.702
|
0.588
|
2.109
|
0.233
|
0.691
|
1.096
|
3.984
|
0.309
|
0.134
|
0.54
|
0.617
| |
|
1.8
|
Number of
Internet users (2017), %
|
86.54
|
2.095
|
0.814
|
0.275
|
0.593
|
0.775
|
0.336
|
0.259
|
0.951
|
1.152
|
1.753
| |
|
1.
Aggregated indicator of the level of country’s economic development and
economic potential
|
101.821
|
7.548
|
-0.5047
|
2.127
|
2.396
|
1.9635
|
-2.4081
|
2.439
|
4.4723
|
4.937
|
25.591
| ||
|
Level of
country’s economic development and economic potential, weighted value
|
35.332
|
2.619
|
-0.175
|
0.738
|
0.831
|
0.681
|
-0.835
|
0.846
|
1.552
|
1.713
|
8.88
| ||
|
2.1
|
National debt (2017), % GNP
|
0.445 |
1.233
|
0.782
|
0.726
|
0.296
|
1.435
|
1.456
|
0.78
|
0.967
|
1.423
|
1.382
|
0.516
|
|
2.2
|
Number of taxes
paid by business (2018)
|
0.451
|
0.287
|
0.862
|
1.395
|
1.272
|
1.518
|
0.451
|
1.6
|
1.231
|
1.56
|
0.369
| |
|
2.3
|
Government
efficiency (2018)
|
17.11
|
19.66
|
1
|
-11.22
|
-10
|
6.89
|
-2.78
|
-7.33
|
-2.44
|
1
|
-0.89
| |
|
2. Aggregated
indicator of the national policy efficiency
|
15.426
|
18.591
|
-0.588
|
-12.911
|
-12.707
|
3.916
|
-3.109
|
-9.897
|
-5.094
|
-1.942
|
-1.775
| ||
|
National
policy, weighted value
|
6.865
|
8.272
|
-0.261
|
-5.745
|
-5.654
|
1.742
|
-1.383
|
-4.404
|
-2.267
|
0.864
|
-0.79
| ||
|
3.1
|
Openness of the
economy (foreign
trade turnover, % GNP in
2018)
|
0.208 |
0.508
|
0.616
|
1.17
|
1.163
|
1.172
|
0.905
|
1.326
|
1.55
|
1.057
|
0.922
|
0.609
|
|
3.2
|
Foreign direct
investment (2018), billion
US dollars
|
9.31
|
0.236
|
0.0001
|
0.006
|
0.003
|
0.001
|
0
|
-0.029
|
0.003
|
0.054
|
1.414
| |
|
3.3
|
Trade balance
(2018), billion
US dollars
|
0.975
|
0
|
-0.006
|
-0.004
|
-0.01
|
-0.0077
|
-0.01
|
0.341
|
-0.013
|
-0.026
|
9.763
| |
|
3.4
|
Net migration
rate
(2010/2015, per 1,000 population) |
-1.909
|
-0.955
|
3.77
|
1.026
|
0
|
3.198
|
0.954
|
0
|
3.675
|
1.575
|
-0.334
| |
|
3. Aggregated indicator of the integration of the
national economy into the world economy and participation in international
factors movement
|
12.702
|
1.807
|
-2.6059
|
0.139
|
1.165
|
-2.2997
|
0.362
|
1.862
|
-2.628
|
-0.625
|
12.12
| ||
|
Integration of the national economy into the world
economy and participation in international factors movement, weighted
value
|
2.642
|
0.376
|
-0.542
|
0.029
|
0.242
|
-0.478
|
0.075
|
0.387
|
-0.546
|
-0.13
|
2.52
| ||
|
Integral indicator of national competitiveness (IC)
|
44.839
|
11.267
|
-0.978
|
-4.978
|
-4.581
|
1.945
|
-2.143
|
-3.171
|
-1.261
|
2.447
|
10.61
| ||
Source: compiled by the author.
Table 8
Ranking of the national economies competitiveness
|
Country |
Aggregate
indicator of competitive advantages (competitiveness factors) of the national
economy
|
Integral
indicator of national competitiveness (IC)
|
National
competitiveness ranking
| |||||
|
Level
of country’s economic development and economic potential
|
National
policy
|
Integration
of the national economy into the world economy and participation in
international factors movement
| ||||||
|
Value
|
Rank
|
Value
|
Rank
|
Value
|
Rank
| |||
|
Australia
|
35.332
|
1
|
6.865
|
2
|
2.642
|
1
|
44.839
|
1
|
|
New Zealand
|
2.619
|
3
|
8.272
|
1
|
0.376
|
4
|
11.267
|
2
|
|
Micronesia
|
-0.175
|
10
|
-0.261
|
5
|
-0.542
|
11
|
-0.978
|
6
|
|
Solomon Islands
|
0.738
|
8
|
-5.745
|
11
|
0.029
|
7
|
-4.978
|
11
|
|
Vanuatu
|
0.831
|
7
|
-5.654
|
10
|
0.242
|
5
|
-4.581
|
10
|
|
Samoa
|
0.681
|
9
|
1.742
|
3
|
-0.478
|
9
|
1.945
|
5
|
|
Kiribati
|
-0.835
|
11
|
-1.383
|
7
|
0.075
|
6
|
-2.143
|
8
|
|
Papua New Guinea
|
0.846
|
6
|
-4.404
|
9
|
0.387
|
3
|
-3.171
|
9
|
|
Tonga
|
1.552
|
5
|
-2.267
|
8
|
-0.546
|
10
|
-1.261
|
7
|
|
Fiji
|
1.713
|
4
|
0.864
|
4
|
-0.13
|
8
|
2.447
|
4
|
|
Russia
|
8.88
|
2
|
-0.79
|
6
|
2.52
|
2
|
10.61
|
3
|
The analysis allows us to draw the following conclusions.
According to the absolute value of the integral index of competitiveness Australia followed by New Zealand were two leaders in 2018. Russia was the third. But Russia significantly lagged behind Australia by the level of economic development and economic potential and the effectiveness of national policy. The positions in the ranking of island independent microstates are as follows. Fiji and Samoa are the leading microstates ranking 4th and 5th respectively. Papua New Guinea (9), Vanuatu (10) and the Solomon Islands (11) were the outsiders (Table 8) because of national policy inefficient.
Assessment of the competitiveness of the South Pacific countries and Russia on the basis of the Human Development Index
We will try to assess the positions of the South Pacific countries on the basis of HDI data in 2018. First of all, let’s look through the HDI itself and consider its components (Table 9).
Table 9
HDI and its components for the South Pacific region and Russia, 2018
|
Countries
|
HDI
|
Life expectancy at birth, years
|
Expected years of schooling, years
|
Mean years of schooling, years
|
GNI per capita, $
|
HDI rank
|
|
Very high human development
| ||||||
|
…
|
…
|
…
|
…
|
…
|
…
|
…
|
|
Australia
|
0.939
|
83.1
|
22.9
|
12.9
|
43560
|
3
|
|
…
|
…
|
…
|
…
|
…
|
…
|
…
|
|
New
Zealand
|
0.917
|
82
|
18.9
|
22.5
|
33970
|
16
|
|
…
|
…
|
…
|
…
|
…
|
…
|
…
|
|
Russia
|
0.816
|
71.2
|
15.5
|
12
|
24233
|
49
|
|
…
|
…
|
…
|
…
|
…
|
…
|
…
|
|
High human development
| ||||||
|
Palau
|
0.798
|
73.4
|
15.6
|
12.3
|
12831
|
60
|
|
…
|
…
|
…
|
…
|
…
|
…
|
…
|
|
Fiji
|
0.741
|
70.4
|
15.3
|
10.8
|
8324
|
92
|
|
…
|
…
|
…
|
…
|
…
|
…
|
…
|
|
Tonga
|
0.726
|
73.2
|
14.3
|
11.2
|
5547
|
98
|
|
…
|
…
|
…
|
…
|
…
|
…
|
…
|
|
Samoa
|
0.713
|
75.2
|
12.5
|
10.3
|
5909
|
104
|
|
…
|
…
|
…
|
…
|
…
|
…
|
…
|
|
Marshall Islands
|
0.708
|
73.6
|
13.0
|
10.9
|
5125
|
106
|
|
…
|
…
|
…
|
…
|
…
|
…
|
…
|
|
Medium human development
| ||||||
|
Micronesia
|
0.627
|
69.3
|
11.7
|
8
|
3843
|
131
|
|
…
|
…
|
…
|
…
|
…
|
…
|
…
|
|
Kiribati
|
0.612
|
66.5
|
12.9
|
7.9
|
3042
|
134
|
|
…
|
…
|
…
|
…
|
…
|
…
|
…
|
|
Vanuatu
|
0.603
|
72.3
|
10.9
|
6.8
|
2995
|
138
|
|
…
|
…
|
…
|
…
|
…
|
…
|
…
|
|
Low human development
| ||||||
|
Solomon
Islands
|
0.546
|
71.0
|
10.2
|
5.5
|
1872
|
152
|
|
Papua
New Guinea
|
0.544
|
65.7
|
10
|
4.6
|
3403
|
153
|
|
…
|
…
|
…
|
…
|
…
|
…
|
…
|
|
Other countries or territories
| ||||||
|
Nauru
|
…
|
…
|
10.3
|
…
|
18573
|
…
|
|
Tuvalu
|
…
|
…
|
…
|
…
|
5888
|
…
|
Source: compiled by the author according to Human Development Indices and Indicators. 2018 Statistical Update. United Nations Development Programme. 2018. Retrieved from: http://hdr.undp.org/en/content/human-development-indices-indicators-2018-statistical-update (date of access 10.01.2020).
Australia (3) and New Zealand (16) were included in the group of countries with very high HDI. Russia is in the same group (on the 49th position). Low GNI per capita and insufficient life expectancy are еhe main reasons for the significant gap between the countries of the South Pacific region and the countries-leaders of the HDI rating. The 2018 UNDP HDI report also provides average data for groups of countries (Table 10). The similar summary for the countries of the South Pacific region (excluding Australia and New Zealand) are presented in Table 11.
Table 10
Average HDI 2018 data by countries’ groups
|
Countries’ groups
|
HDI
|
Life expectancy at birth, years
|
Expected years of schooling, years
|
Mean years of schooling, years
|
GNI per capita, $
|
|
Very high human development
|
0.894
|
79.5
|
16.4
|
12.2
|
40041
|
|
High human development
|
0.757
|
76.0
|
14.1
|
8.2
|
14999
|
|
Medium human development
|
0.645
|
69.1
|
12.0
|
6.7
|
6849
|
|
Low human development
|
0.504
|
60.8
|
9.4
|
4.7
|
2521
|
|
World
|
0.728
|
72.2
|
12.7
|
8.4
|
15295
|
Table 11
Calculation of the average HDI 2018 and its components for the South Pacific countries (excluding Australia and New Zealand)
|
Country
|
HDI
|
Life expectancy at birth, years
|
Expected years of schooling, years
|
Mean years of schooling, years
|
GNI per capita, $
|
|
Palau
|
0.798
|
73.4
|
15.6
|
12.3
|
12831
|
|
Fiji
|
0.741
|
70.4
|
15.3
|
10.8
|
8324
|
|
Tonga
|
0.726
|
73.2
|
14.3
|
11.2
|
5547
|
|
Samoa
|
0.713
|
75.2
|
12.5
|
10.3
|
5909
|
|
Marshall Islands
|
0.708
|
73.6
|
13
|
10.9
|
5125
|
|
Micronesia
|
0.627
|
69.3
|
11.7
|
8
|
3843
|
|
Kiribati
|
0.612
|
66.5
|
12.9
|
7.9
|
3042
|
|
Vanuatu
|
0.603
|
72.3
|
10.9
|
6.8
|
2995
|
|
Solomon
Islands
|
0.546
|
71
|
10.2
|
5.5
|
1872
|
|
Papua
New Guinea
|
0.544
|
65.7
|
10
|
4.6
|
3403
|
|
Average
|
0.662
|
71.06
|
12.64
|
8.83
|
5289
|
Source: compiled by the author according to Human Development Indices and Indicators. 2018 Statistical Update. United Nations Development Programme. 2018. Retrieved from: http://hdr.undp.org/en/content/human-development-indices-indicators-2018-statistical-update (date of access 10.01.2020).
Thus, according to the average HDI indicator (0.662), the group of independent microstates of the South Pacific region is generally closer to the countries with the medium level of development (0.645). If we conduct the analyses in the context of individual indicators, we will see that in terms of life expectancy small microstates of the South Pacific region (71.06) are closer to the countries with the medium level of development (69.1). In terms of expected years of schooling the South Pacific microstates (12.64) are also closer to the countries with the medium level of development (12.0). And in terms of mean years of schooling (8.83) they are closer to the countries with high level of development (8.2) (Fig. 3). According to average GNI per capita ($5.289) the South Pacific microstates are between countries with medium ($6849) and low ($2.521) level of development.
If we compare the countries of the South Pacific region with each other in terms of HDI 2018, we can note the following: in terms of life expectancy Australia (83.1) and New Zealand (82) are the leaders among the South Pacific countries, while Kiribati (66.5) and Papua New Guinea (65.7) lag behind. According to this indicator, Russia is more than 10 years behind not only two leading countries, but also almost all the microstates of the South Pacific region. Australia (22.9) and New Zealand (18.9) lead the way in terms of expected years of schooling, while Vanuatu (10.9), Solomon Islands (10.2) and Papua New Guinea (10) lag behind. Russia is at the level of such countries as Palau (15.6) and Fiji (15.3) on this indicator. In terms of mean years of schooling, New Zealand is the leader (22.5), and it is followed by Vanuatu (6.8), Solomon Islands (5.5) and Papua New Guinea (4.6). Finally, in terms of GNI per capita Australia ($43.560) and New Zealand ($33.970) lead the way; and the rest of the South Pacific microstates lag behind by more than 8 times (Fig. 3, 4).
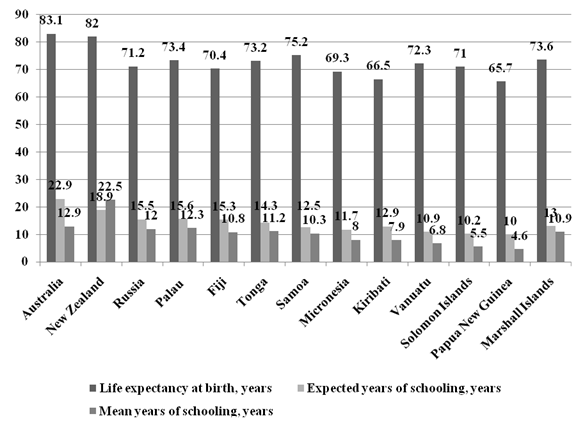
Notes: data for Tuvalu, Nauru, Niue are not provided.
Figure 3. Indicators of life expectancy and learning in the South Pacific region (Oceania) and Russia in the HDI rating 2018
Source: compiled by the author according to Human Development Indices and Indicators. 2018 Statistical Update. United Nations Development Programme. 2018. Retrieved from: http://hdr.undp.org/en/content/human-development-indices-indicators-2018-statistical-update (date of access 10.01.2020).
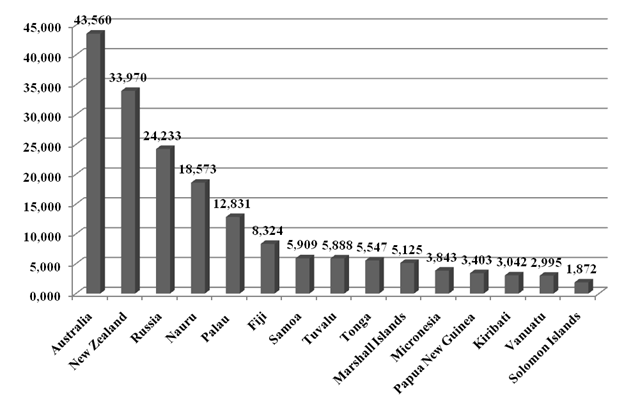
Notes: data for Niue are not provided.
Figure 4. GNI per capita in the South Pacific region and Russia in the 2018 HDI ranking, $
Source: compiled by the author according to Human Development Indices and Indicators. 2018 Statistical Update. United Nations Development Programme. 2018. Retrieved from: http://hdr.undp.org/en/content/human-development-indices-indicators-2018-statistical-update (date of access 10.01.2020).
The analysis of the changes in the HDI of the South Pacific countries in 1990–2017 is conducted (Table 12). The data show that there have been no substantial changes in the HDI ranking of the South Pacific countries. Fiji (+3 positions during the past 5 years) and Tonga (+2 positions) have improved slightly.
Moreover, the dynamics of the HDI for 27 years shows a stable improvement in the South Pacific region in terms of human development. A slight decline was observed only in Kiribati: in 2016 the HDI decline from 0.621 to 0.610 (i.e. by 1.7 %), but in 2017 it went up again. A similar trend was observed in the Solomon Islands during the same period: a decrease in the HDI from 0.546 to 0.543 (i.e. by 0.05 %).
Table 12
HDI trends in1900–2017
|
HDI
rank
|
Country
|
1990
|
2000
|
2010
|
2012
|
2014
|
2015
|
2016
|
2017
|
Change
in HDI rank 2012–2017
|
|
3
|
Australia
|
0.866
|
0.898
|
0.923
|
0.929
|
0.933
|
0.936
|
0.938
|
0.939
|
0
|
|
16
|
New Zealand
|
0.818
|
0.869
|
0.899
|
0.905
|
0.910
|
0.914
|
0.915
|
0.917
|
–1
|
|
49
|
Russia
|
0.734
|
0.720
|
0.780
|
0.798
|
0.807
|
0.813
|
0.815
|
0.816
|
3
|
|
60
|
Palau
|
…
|
0.743
|
0.769
|
0.778
|
0.786
|
0.793
|
0.798
|
0.798
|
1
|
|
92
|
Fiji
|
0.643
|
0.683
|
0.711
|
0.719
|
0.730
|
0.738
|
0.738
|
0.741
|
5
|
|
98
|
Tonga
|
0.648
|
0.673
|
0.712
|
0.717
|
0.717
|
0.721
|
0.724
|
0.726
|
2
|
|
104
|
Samoa
|
0.620
|
0.647
|
0.693
|
0.697
|
0.703
|
0.706
|
0.711
|
0.713
|
0
|
|
106
|
Marshall Islands
|
…
|
…
|
…
|
…
|
…
|
…
|
…
|
0.708
|
…
|
|
131
|
Micronesia
|
…
|
0.552
|
0.608
|
0.616
|
0.618
|
0.627
|
0.627
|
0.627
|
–1
|
|
134
|
Kiribati
|
…
|
0.552
|
0.590
|
0.598
|
0.616
|
0.621
|
0.610
|
0.612
|
0
|
|
138
|
Vanuatu
|
…
|
…
|
0.591
|
0.592
|
0.598
|
0.599
|
0.600
|
0.603
|
–2
|
|
152
|
Solomon Islands
|
…
|
0.450
|
0.507
|
0.529
|
0.539
|
0.546
|
0.543
|
0.546
|
1
|
|
153
|
Papua New Guinea
|
0.380
|
0.449
|
0.520
|
0.530
|
0.536
|
0.542
|
0.543
|
0.544
|
–1
|
|
…
|
Nauru
|
…
|
…
|
…
|
…
|
…
|
…
|
…
|
…
|
…
|
|
…
|
Tuvalu
|
…
|
…
|
…
|
…
|
…
|
…
|
…
|
…
|
…
|
Source: compiled by the author according to Human Development Indices and Indicators. 2018 Statistical Update. United Nations Development Programme. 2018. Retrieved from: http://hdr.undp.org/en/content/human-development-indices-indicators-2018-statistical-update (date of access 10.01.2020).
To structure the strengths and opportunities of the South Pacific countries, i.e. the factors of competitive advantages, as well as to identify their weaknesses and threats the SWOT analysis has been conducted (Table 13).
Table 13
SWOT-analysis of the national competitiveness of the South Pacific countries
|
Strong
|
Weak
|
|
1. There are virtually no traditional threats to
the security of microstates in the form of an invasion by neighbouring states.
2. Cultural-historical and geographical features, unique culture and national colour. 3. Availability of rich mineral resources. 4. Openness of the economy. |
1. The South Pacific countries do not have enough
own security forces to protect themselves from possible attacks of more powerful
neighbours.
2. They have practically no armed forces. The lack of armed forces to keep the extremists in check. 3. Diversity of ethnic composition. 4. Significant distance from the centers of civilization, inaccessibility, lack of modern transport communications. 5. Low living standard. 6. High national debt. 7. A great number of taxes. |
|
Opportunities
|
Threats
|
|
1. The South Pacific countries must rely on
diplomacy and good relations with States that play a leading role both in the
region and in the world.
2. Prospects for tourism development. 3. The South Pacific region is of interest to scientists and researchers. 4. Opportunities for the development of the mining industry. 5. The prospects of integration within the APEC framework. 6. Prospects for the development of foreign economic relations. |
1. The threat of an invasion by a stronger
neighbour.
2. The threat of inter-ethnic conflicts. 3. Unavailability of the benefits of modern civilization. 4. Technological gap. 5. Isolation. 6. Lack of food. 7. Brain drain among the youth to Australia in search of work and earnings. 8. Problems of national debt repayment, lack of financial resources. 9. The inefficiency of the government. |
Thus, it is possible to particularize the competitive advantages of the South Pacific countries.
1. The remoteness of the continent allows to preserve the unique culture and national flavor of the South Pacific region. The South Pacific countries could be of potential interest to both researchers and tourists. And their remoteness and isolation reduce the possibility of threats to military security.
2. The endowment of the region with mineral resources provides opportunities for the mining industry development.
3. The openness of the economy of the South Pacific countries creates prospects for the development of foreign economic relations and economic integration.
Conclusion
The conducted research allows us to draw the following conclusions.
The microstates of the South Pacific region are not represented in the published international rankings of global competitiveness. The developed countries of the South Pacific region such as Australia and New Zealand hold a consistently high stable position.
Our analysis of the integral indicators of national competitiveness shows that Australia is the leading country in the South Pacific region. New Zealand is the second. Russia has significantly lagged behind Australia (these data correspond to international competitiveness ratings). Fiji and Samoa are the leaders in the ranking among the island independent microstates. The outsiders are Papua New Guinea, Vanuatu and the Solomon Islands. The main causes of the lag are in inefficient mechanisms of public policy.
Having conducted the analyses of the reviewed countries by the Human Development Index, we came to the following conclusions. The Human Development Index, which is calculated on the basis of the fundamental measures of human development such as life expectancy, mean years of schooling, expected duration of schooling and gross national income per capita, could be used as one of the criteria of the national competitiveness level because this index takes into account basic vital interests of the people. Australia is the leader in HDI ranking (3) among the countries of the South Pacific region. Papua New Guinea is the outsider (153). Life expectancy and GNI per capita are the main problem areas for the South Pacific microstates.
Thus, in order to increase the level of national competitiveness of the South Pacific countries, it is necessary to focus on the following directions:
- improvement of the national policy mechanisms and development of the government efficiency;
- development of the measures and mechanisms of demographic policy aimed at increasing the life expectancy;
- improvement of the overall economic situation in order to provide the increase of the income of the population;
- preservation of the unique culture of the South Pacific countries in a globalizing world.
[1] The Institute for Strategy and Competitiveness. Retrieved from: https://www.isc.hbs.edu/COMPETITIVENESS-ECONOMIC-DEVELOPMENT/RESEARCH-AND-APPLICATIONS/NATIONAL-COMPETITIVENESS/Pages/default.aspx (date of access 10.01.2020).
[2] Niue is a self-governing State in the Commonwealth with New Zealand, independently participating in regional international relations.
[3] Human Development Indices and Indicators. 2018 Statistical Update. United Nations Development Programme, 2018. Retrieved from: http://hdr.undp.org/en/content/human-development-indices-indicators-2018-statistical-update (date of access 10.01.2020).
[4] Global Competitiveness Report 2019: How to end a lost decade of productivity growth. World Economic Forum. Retrieved from: https://www.weforum.org/reports/how-to-end-a-decade-of-lost-productivity-growth (date of access 10.01.2020).
[5] IMD World Competitiveness Rankings 2019. Retrieved from: https://www.imd.org/wcc/world-competitiveness-center-rankings/world-competitiveness-ranking-2019/ (date of access 10.01.2020).
[6] The comparison is made on the basis of following scale: “1” – equal importance; “3” – moderate superiority; “5” – sufficient superiority; “7” – strong superiority; “9” – extremely strong superiority; “2”, “4”, “6”, “8” – intermediate estimates between two neighbouring ones. Inverse values to the above numbers (1/3, 1/5, 1/7, 1/9 etc.) are put down in the following cases: if the comparison of one element with another obtained a whole number, then when comparing the second element with the first one the reverse (fractional) number is put down. The normalized vector of priorities is calculated as follows [10, p. 157–160] (Drobot, 2015, р. 157–160). For each row of the matrix, all elements are multiplied, and the N-th root is extracted (n is a number of criteria (indicators)). The resulting numbers (a1, a2, ..., an) are summed, and then each of these numbers is divided by the resulting sum. It gives the components of the vector of priorities which add up to 1 and represent the weight values of the criteria priorities.
Источники:
2. Богатырева В.В., Бословяк В.В.Человеческий капитал как основа повышения конкурентоспособности и инвестиционной привлекательности национальной экономики // Модернизация хозяйственного механизма сквозь призму экономических, правовых социальных и инженерных подходов: Материалы XII международной научно-практической конференции, 2018. – С. 35–37.
3. Бондаренко И.С. Человеческий капитал – определяющий фактор конкурентоспособности национальной экономики // Вестник Тюменского государственного университета. Социально-экономические и правовые исследования. – 2015. – Т. 1. – № 3. – С. 207–220.
4. Галимова Л.К., Юдина Н.А., Лившиц С.А., Дунаева Т.Ю.Определение основных аспектов конкурентоспособности национальной экономики // Электроэнергетика глазами молодежи – 2018 Материалы IX Международной молодежной научно-технической конференции. В 3-х томах. Ответственный редактор Э.В. Шамсутдино, 2018. – С. 46–47.
5. Гармашова Е.П. Основные концепции конкурентоспособности национальной экономики // Вестник Сургутского государственного университета. – 2019. – № 1 (23). – С. 51–57.
6. Го Ч. Теоретические аспекты конкурентоспособности иностранных и национальных коммерческих банков на банковском рынке КНР // Экономика. Бизнес. Банки. – 2019. – № 2 (29). – С. 167–182.
7. Дробот Е.В. Концептуальная модель формирования конкурентоспособности приграничного региона // Экономические отношения. – 2012. – Том 2. – № 2. – С. 6–10. – doi: 10.18334/.37376.
8. Дробот Е.В. Особенности формирования конкурентоспособности национальной экономики России: дисс. … канд. экон. наук: 08.00.01 / Дробот Елена Валерьевна. – Санкт-Петербург, 2004. – 199 с.
9. Дробот Е.В. Современные мирохозяйственные связи и глобализация мировой экономики: Монография. ― СПб.: Троицкий мост, 2016. – 224 с.
10. Дробот Е.В. Управление конкурентоспособностью национальной экономики в условиях глобализации. – СПб.: Троицкий мост, 2015. – 224 с.
11. Дробот Е.В. Эволюция теории национальной конкурентоспособности // Экономические отношения. – 2012. – Том 2. – № 2. – С. 27–40. – doi: 10.18334/.37337.
12. Дробот Е.В., Клевлеева А.Р., Костылева С.О. Конкурентоспособность экономики России: факторы и тенденции // Экономические отношения. – 2014. – Том 4. – № 1. – С. 27–31. – doi: 10.18334/.37331.
13. Дробот Е.В., Костылева С.О. Методы оценки последствий экономической интеграции для стран Евразийского экономического союза // Российское предпринимательство. – 2017. – Том 18. – № 1. – С. 23–40. doi: 10.18334/rp.18.1.37212
14. Захарьев Я.О. Бугенвиль: тлеющий региональный конфликт и объект геостратегических экономических интересов участников «Большой игры» // Экономические отношения. – 2019. – Том 9. – № 3. – С. 1549–1562. – doi: 10.18334/eo.9.3.40873.
15. Захарьев Я.О. Папуа-Новая Гвинея: проблемы экономической интеграции в начале ХХI века // Экономические отношения. – 2017. – Том 7. – № 3. – С. 279–286. – doi: 10.18334/eo.7.3.37982.
16. Костюченко И.Г. Азиатско-Тихоокеанский регион: вопросы экономической интеграции в начале ХХI века // Экономические отношения. – 2017. – Том 7. – № 2. – С. 183–190. – doi: 10.18334/eo.7.2.37990.
17. Костюченко И.Г. Некоторые вопросы экономического развития Азиатско-Тихоокеанского региона // Экономические отношения. – 2018. – Том 8. – № 1. – С. 81–94. – doi: 10.18334/eo.8.1.38763.
18. Мезинова И.А. Европейский механизм мониторинга иностранных инвестиций как способ обеспечения национальной безопасности и глобальной промышленной конкурентоспособности стран ЕС // Московский экономический журнал. – 2019. – № 2. – С. 13.
19. Портер М.Е. Конкурентная стратегия: Методика анализа отраслей и конкурентов / пер. с англ. И. Минервина. – М.: «Альпина Паблишер», 2011. – 454 с.
20. Портер М.Е. Конкурентное преимущество: Как достичь высокого результата и обеспечить его устойчивость / пер. с англ. Е. Калининой. – М.: «Альпина Паблишер», 2008. – 720 с.
21. Портер М.Е. Международная конкуренция: Конкурентные преимущества стран. – М.: Международные отношения, 1993. – 896 с.
22. Портер М.Е. Конкуренция. – М.; СПб.; Киев: Вильямс, 2-е изд. – 2006. – 608 с.
23. Скрипниченко А.В., Пале С.Е. Актуальные проблемы Новой Зеландии в начале ХХI века // Экономические отношения. – 2017. – Том 7. – № 2. – С. 191–198. – doi: 10.18334/eo.7.2.37983.
24. Ульянина А.Е. Опыт Новой Зеландии в начале ХХI века для региональных экономик субъектов Дальнего Востока Российской Федерации // Экономические отношения. – 2017. – Том 7. – № 4. – С. 409–420. – doi: 10.18334/eo.7.4.38260.
25. Цикин А.М. Парадигма формирования моделей национальной конкурентоспособности // Экономика. Бизнес. Банки. – 2019. – № 1 (28). – С. 8–17.
26. Шкиотов С.В., Маркин М.И., Майорова М.А. Конкурентоспособность российской экономики: верификация теории национальной конкурентоспособности // Интернет-журнал Науковедение. – 2016. – Т. 8. – № 6 (37). – С. 86.
27. Chih-Kai, Chen (2013). Social capital and national competitiveness. Journal of Statistics and Management Systems, 14, 295–313.
28. Delgado, M., Ketels, C., Porter, M., Stern, S. (2012). The Determinants of National Competitiveness. NBER Working Paper No. w18249. Retrieved from: https://ssrn.com/abstract=2119004 (date of access 10.01.2020).
29. Luminita, C.P., Bacali, L., Lungu, F. (2013). Research on Competitiveness. GRA – Global Research Analysis, 2, 111–113.
30. Porter , M.E. (2008). On competition, Boston: Harvard Business School, 608.
31. Porter M.E. (1985). Competitive Advantage: Creating and Sustaining Superior Performance. New York: The Free Press, 592.
32. Porter M.E. (1990). Competitive Advantage of Nations. New York: Free Press, 896.
33. Porter M.E. (1980). Competitive Strategy: Techniques for Analyzing Industries and Competitors. New York: The Free Press, 397.
Страница обновлена: 20.05.2026 в 07:35:41
Download PDF | Downloads: 91 | Citations: 5
Comparative analysis of the international competitiveness of the region (on the example of independent states of the South Pacific region)
Drobot E.V.Journal paper
Journal of International Economic Affairs
Volume 10, Number 2 (April-June 2020)
Abstract:
The problems of national competitiveness analysis are widely considered in modern publications. However, research and comparative analysis of the national competitiveness of the South Pacific island States remain neglected. In fact, such studies have never been conducted. The purpose of this study is to analyze the international competitiveness of the South Pacific independent States, which allows to determine the factors of their competitive advantage, as well as to assess the possible causes of their competitive weakness. The hypothesis of the study is that the South Pacific independent States, most of which belong to the category of microstates, should have a similar factors of competitive advantage. The official statistics of the UN, the World Bank etc. were used as the initial data. A comparative analysis of national competitiveness of the South Pacific countries is based on the author's methodology of the integral indicator of national competitiveness. The analysis shows that Australia and New Zealand are two leaders in the region. Fiji and Samoa are leading among the island independent microstates. Papua New Guinea, Vanuatu and Solomon Islands are the outsiders. The main causes of the lag are in inefficient mechanisms of public policy. Common factors of competitive advantages of the South Pacific countries are their geographical isolation, endowment of mineral resources, and openness of the South Pacific. The results of the research will be of interest to the specialists in international relations and competitiveness. Further research may be related to the development of mechanisms to improve the South Pacific competitiveness.
Keywords: analytic hierarchy process, competitive advantage, competitiveness factors, degree of the economy integration into the world economy, factors of competitive advantage, human development index, integral indicator of national competitiveness, life expectancy, national competitiveness, living standard, productivity, South Pacific region
JEL-classification: O56, O57, F01, F63
References:
Balashov V.V., Dzhavadov T.E. (2019). Novaya Zelandiya v Yuzhno-Tikhookeanskom regione: reshenie aktualnyh problem [New Zealand in the South Pacific region: the solutions for vital problems]. Journal of International Economic Affairs. (1). 33–40. (in Russian). doi: 10.18334/eo.9.1.39655.
Bogatyreva V.V., Boslovyak V.V. (2018). Chelovecheskiy kapital kak osnova povysheniya konkurentosposobnosti i investitsionnoy privlekatelnosti natsionalnoy ekonomiki [Human capital as the basis for improving the competitiveness and investment attractiveness of the national economy] Modernization of the economic mechanism through the prism of economic, legal, social and engineering approaches. 35–37. (in Russian).
Bondarenko I.S. (2015). Chelovecheskiy kapital – opredelyayushchiy faktor konkurentosposobnosti natsionalnoy ekonomiki [Human resources - a determining factor of the national economy's competitiveness]. Vestnik Tyumenskogo gosudarstvennogo universiteta. Sotsialno-ekonomicheskie i pravovye issledovaniya. (3). 207–220. (in Russian).
Chih-Kai Chen (2013). Social capital and national competitiveness Journal of Statistics and Management Systems. (14). 295–313.
Drobot E.V. (2004). Osobennosti formirovaniya konkurentosposobnosti natsionalnoy ekonomiki Rossii [Particularities of competitiveness of the national economy of Russia] (in Russian).
Drobot E.V. (2012). Evolyutsiya teorii natsionalnoy konkurentosposobnosti [Evolution of the theory of national competitiveness]. Journal of International Economic Affairs. (2). 27–40. (in Russian). doi: 10.18334/.37337.
Drobot E.V. (2012). Kontseptualnaya model formirovaniya konkurentosposobnosti prigranichnogo regiona [Conceptual model of the border region competitiveness formation]. Journal of International Economic Affairs. (2). 6–10. (in Russian). doi: 10.18334/.37376.
Drobot E.V. (2015). Upravlenie konkurentosposobnostyu natsionalnoy ekonomiki v usloviyakh globalizatsii [Management of competitiveness of the national economy in conditions of globalization] (in Russian).
Drobot E.V. (2016). Sovremennye mirokhozyaystvennye svyazi i globalizatsiya mirovoy ekonomiki [Modern world economic relations and globalization of the world economy] (in Russian).
Drobot E.V., Klevleeva A.R., Kostyleva S.O. (2014). Konkurentosposobnost ekonomiki Rossii: faktory i tendentsii [Competitiveness of economy of Russia: factors and tendencies]. Journal of International Economic Affairs. (1). 27–31. (in Russian). doi: 10.18334/.37331.
Drobot E.V., Kostyleva S.O. (2017). Metody otsenki posledstviy ekonomicheskoy integratsii dlya stran Evraziyskogo ekonomicheskogo soyuza [Evaluation methods of economic integration consequences for the countries of the Eurasian Economic]. Russian Journal of Entrepreneurship. (1). 23–40. (in Russian). doi: 10.18334/rp.18.1.37212.
Galimova L.K., Yudina N.A., Livshits S.A., Dunaeva T.Yu. (2018). Opredelenie osnovnyh aspektov konkurentosposobnosti natsionalnoy ekonomiki [Defining the main aspects of the national economy's competitiveness] Electric power industry through the eyes of the youth 2018. 46–47. (in Russian).
Garmashova E.P. (2019). Osnovnye kontseptsii konkurentosposobnosti natsionalnoy ekonomiki [Basic concepts of national economy competitiveness]. Bulletin of Surgut State University. (1). 51–57. (in Russian).
Go Ch. (2019). Teoreticheskie aspekty konkurentosposobnosti inostrannyh i natsionalnyh kommercheskikh bankov na bankovskom rynke KNR [Theoretical aspects of competitiveness of foreign and national commercial banks on the banking market of China]. Economy. Business. Banks. (2). 167–182. (in Russian).
Kostyuchenko I.G. (2017). Aziatsko-Tikhookeanskiy region: voprosy ekonomicheskoy integratsii v nachale KhKhI veka [Asia-Pacific region: issues of economic integration in the early 21st century]. Journal of International Economic Affairs. (2). 183–190. (in Russian). doi: 10.18334/eo.7.2.37990.
Kostyuchenko I.G. (2018). Nekotorye voprosy ekonomicheskogo razvitiya Aziatsko-Tikhookeanskogo regiona [Some issues of economic development in the Asia-Pacific region]. Journal of International Economic Affairs. (1). 81–94. (in Russian). doi: 10.18334/eo.8.1.38763.
Luminita C.P., Bacali L., Lungu F. (2013). Research on Competitiveness GRA – Global Research Analysis. (2). 111–113.
Mezinova I.A. (2019). Evropeyskiy mekhanizm monitoringa inostrannyh investitsiy kak sposob obespecheniya natsionalnoy bezopasnosti i globalnoy promyshlennoy konkurentosposobnosti stran ES [European mechanism for monitoring foreign investment as a way to ensure national security and global industrial competitiveness of EU countries]. Moscow Economic Journal. (2). 13. (in Russian).
Porter M.E. (1980). Competitive Strategy: Techniques for Analyzing Industries and Competitors
Porter M.E. (1985). Competitive Advantage: Creating and Sustaining Superior Performance
Porter M.E. (1990). Competitive Advantage of Nations
Porter M.E. (1993). Mezhdunarodnaya konkurentsiya: Konkurentnye preimushchestva stran [International competition: Competitive advantages of countries] (in Russian).
Porter M.E. (2006). Konkurentsiya [On competition] (in Russian).
Porter M.E. (2008). On competition
Porter M.E. (2008). Konkurentnoe preimushchestvo: Kak dostich vysokogo rezultata i obespechit ego ustoychivost [Competitive advantage: How to achieve high results and ensure its sustainability] (in Russian).
Porter M.E. (2011). Konkurentnaya strategiya: Metodika analiza otrasley i konkurentov [Competitive strategy: Techniques for analyzing industries and competitors] (in Russian).
Shkiotov S.V., Markin M.I., Mayorova M.A. (2016). Konkurentosposobnost rossiyskoy ekonomiki: verifikatsiya teorii natsionalnoy konkurentosposobnosti [Competitiveness of the russian economy: verification of the theory of national competitiveness]. Naukovedenie. (6). 86. (in Russian).
Skripnichenko A.V., Pale S.E. (2017). Aktualnye problemy Novoy Zelandii v nachale KhKhI veka [Topical problems of New Zealand in the early 21st century]. Journal of International Economic Affairs. (2). 191–198. (in Russian). doi: 10.18334/eo.7.2.37983.
Tsikin A.M. (2019). Paradigma formirovaniya modeley natsionalnoy konkurentosposobnosti [Industrial policy and sustainable development of economy]. Economy. Business. Banks. (1). 8–17. (in Russian).
Ulyanina A.E. (2017). Opyt Novoy Zelandii v nachale KhKhI veka dlya regionalnyh ekonomik subektov Dalnego Vostoka Rossiyskoy Federatsii [Experience of New Zealand at the beginning of the 21st century for the regional economies of the subjects of the Far East of the Russian Federation. Journal of international economic affairs]. Journal of International Economic Affairs. (4). 409–420. (in Russian). doi: 10.18334/eo.7.4.38260.
Zakharev Ya.O. (2017). Papua-Novaya Gvineya: problemy ekonomicheskoy integratsii v nachale KhKhI veka [Papua-New Guinea: issue of economic integration at the beginning of the 21st centry]. Journal of International Economic Affairs. (3). 279–286. (in Russian). doi: 10.18334/eo.7.3.37982.
Zakharev Ya.O. (2019). Bugenvil: tleyushchiy regionalnyy konflikt i obekt geostrategicheskikh ekonomicheskikh interesov uchastnikov «Bolshoy igry» [Bougainville: smoldering regional conflict and the object of geostrategic economic interests of the participants of the «Big game»]. Journal of International Economic Affairs. (3). 1549–1562. (in Russian). doi: 10.18334/eo.9.3.40873.