The influence of human capital traits on salary expectation disclosure: a study of the St. Petersburg labor market
Mahar D.H.1![]() , Ramadhani B.Y.A.2
, Ramadhani B.Y.A.2![]()
1 National Research University Higher School of Economics, ,
2 Universitas Negeri Surabaya, ,
Скачать PDF | Загрузок: 41
Статья в журнале
Экономика труда (РИНЦ, ВАК)
опубликовать статью | оформить подписку
Том 10, Номер 11 (Ноябрь 2023)
Эта статья проиндексирована РИНЦ, см. https://elibrary.ru/item.asp?id=55927485
Аннотация:
Human characteristics do impact the decisions of the people in every aspect of life. This study aims to analyze the characteristics that can impact the applicants’ decision to include their salary expectations in their resume when applying for a new position. Specifically, this includes education level, working experience, age differences and gender gap. The data was collected from one of the leading Russian job portal websites, i.e., HH.ru. The dataset consisted of applicants’ who applied for the managerial positions. Two different methods of analysis were used to study these variables and the relationship with the salary expectations. T-test analysis was used to compare the means of the variables. In the second step, 3 models of logistic regression analysis were used with different combination of variables to study the relationship and their impacts. Our study showed the significant impacts of education level and skills, working experience and gender on the salary expectations. The authors concluded that people with higher number of skills, working experience and possess higher education level, tends to not mention their salary expectations in their resume and vice versa. This study can be useful for the Human resources employers who want to hire new employees.
Ключевые слова: salary expectations, labor market, working experience, Skills, education level, gender gap
JEL-классификация: J21, J23, J24, J31, J32, J33, J38
Introduction
Human Capital refers to the "resources within people," such as the skills and knowledge that enable people who have more of these resources to realize higher monetary and psychological income [7, Pp. Xvi, 187] . From this theory, education is the way to get better human capital because education is the most crucial investment in human capital to answer today's global challenges. Based on a study conducted [30], that human capital theory based on the assumption that formal education is closely related and needed to increase the production capacity of an organization.
The labor market is a market that brings together sellers and buyers of labor [17]. Sellers of labor are jobseekers. The job market is a place that coordinates meetings between jobseekers and companies that need labor. To find good quality workers, companies include job requirements in their job search announcements. These requirements include skills, working experience, education, gender, and age. These job requirements are essential to filter people who have the quality and are able to work.
Research Gap
Most studies on human capital focus on how resources affect salary gains for employees and candidates. These studies examine factors like experience, age, and skills [3, pp. 129-142; 11]. However, this study shifts the focus to explore how individual factors influence an applicant's decision to state salary expectations.Research Goal
This study aims to understand the impact of salary expectations on the labor market and why applicants include this in their resumes. The analysis considers variables like education, skill level, work experience, age group, and gender.Hypotheses
H1. The educational level and skill of applicants can influence applicant’s decision to include the salary expectation in the application form of job search website.H2. The working experience of applicants can influence applicant’s decision to include the salary expectation in the application form of job search website.
H3. Age of applicants can influence applicant’s decision to include the salary expectation in the application form of job search website.
H4. The gender of applicants can influence applicant’s decision to include the salary expectation in the application form of job search website.
The authors conclude the research question and hypothesis in the conceptual model that shows in Figure 1.
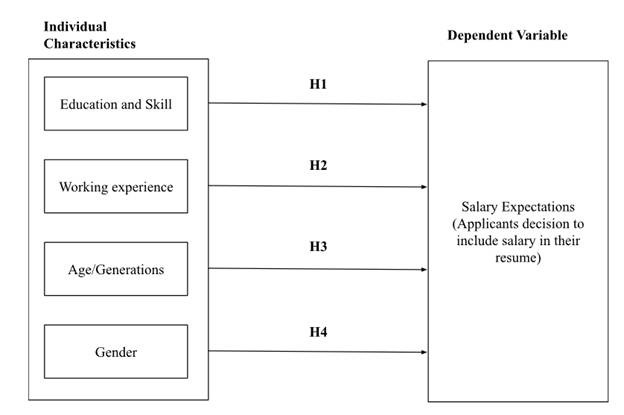
Figure 1. Conceptual Model (Compiled by Authors)
Literature Review
Human Capital Theory
In today's digital landscape, job search websites have simplified the task of finding suitable employment, thereby elevating the competitive landscape for jobseekers [16, pp. 25-43]. Before entering the labor market, individuals invest in education and skills training as guided by Becker's human capital theory, which suggests that resources such as education, skills, and work experience lead to higher financial and psychological rewards [7, Pp. Xvi, 187]. Salary expectations often derive from past earnings, educational qualifications, and job complexity. However, not all applicants include salary expectations in their resumes, a choice influenced by individual factors like education, skills, and work experience [5; 11].Employees with higher educational levels generally command higher salaries [3, pp. 129-142]. Furthermore, salary expectations can serve as a moderating factor in career and industry choices, particularly among students. These expectations are shaped by the educational and skill requirements of specific jobs and impact the decision to pursue employment in certain industries.
Education Level
The role of education in human capital development is pivotal for shaping a skilled and efficient workforce. In a globalized economy where competition is fierce, companies are increasingly vying for highly educated employees to maintain productivity and competitiveness [19, pp. 1-60]. Research further underscores this, [21] showing that regions with a higher density of skilled workers generally witness better salary growth.Specific skills such as foreign language proficiency are highly valued. Such skills not only pave the way for international opportunities, but also positively impact salary expectations [23, pp. 669–690]. To bridge the gap between academic learning and practical application, many educational institutions offer internships or vocational training as part of their curriculum [20, pp. 71-82].
However, the benefits of education are not uniformly distributed across all job sectors or educational levels. [26, pp. 21-29] suggested that the level of education influences the likelihood of an individual applying for higher-ranking jobs in certain sectors. Further, educational background has been found to affect job satisfaction and, consequently, job performance [35, pp. 209-217 ; 34, pp 135-151].
Socioeconomic factors also intertwine with educational attainment to influence career prospects. For example, a study [18, pp. 1-14] found that students with accurate information about potential earnings are more likely to aim for higher-paying jobs. Likewise, social class has been shown to impact job outcomes, with those from lower socioeconomic backgrounds less likely to secure high-paying positions [12, pp. 1-11].
In the European context, the Bologna Process serves as a significant initiative for standardizing higher education. Agreed upon by 29 European countries, it aims to make the higher education system more transparent, high-quality, and attractive to students and employers alike [27]. By understanding these multiple layers of influence, policymakers, educators, and employers can better strategize to optimize the benefits of education in the workforce.
Working Experiences
Work experience holds significant weight in human capital theory, positively influencing work productivity [36, pp 788-807]. It serves as a conduit for acquiring practical skills and knowledge, especially when compared to academic learning, which is more theoretical. Individuals with higher educational qualifications may not always possess extensive work experience, as their time is predominantly invested in academic pursuits.Organizational commitment is closely tied to work experience. The study asserts that employees with extensive work experience are generally more committed to their organization than those with less experience, contributing to the organization's longevity and quality of output [2, pp 26-33].
In the labor market dynamics, work experience plays a pivotal role in shaping salary expectations [36, pp 788-807; 37, pp. 86-97]. It serves as a determinant for potential earnings, especially if one continues in a similar field or job role. It further pointed out that work experience expedites job acquisition, particularly for those with vocational education and training [22, pp. 1-33].
International work experience is increasingly sought by companies navigating global markets. It was represented that such experience equips employees to manage challenges related to internationalization effectively [29, pp. 530-543]. This is corroborated by [32, pp. 37-54], who found that international work experience has a positive impact on career progression.
Age differences
Generational theory suggests that individuals born within a specific time frame share unique values and characteristics influenced by historical and sociocultural events [24, pp. 276-283]. This study focuses on Generations X, Y, and Z in the workforce, as baby boomers are retiring.Generation X, born between the 1970s and early 1980s, values work-life balance and adapts well to change [14, pp. 1-10]. Millennials (born 1977-1994) are tech-reliant and seek meaningful, fulfilling work but are prone to job-hopping and burnout [4, pp. 101-109; 9, pp. 131-139; 8, pp. 15-20]. Generation Z (born 1995-2012) is tech-savvy, quick to learn, and thrives in fast-paced, interactive settings [1, pp. 1-23].
Understanding these generational differences is crucial for organizations aiming to tailor their motivational strategies, career development plans, and mentoring programs [14, pp. 1-10]. In summary, Gen X values stability, millennials desire meaningful work but are susceptible to burnout, and Gen Z excels in technology-driven, social environments. Future research should investigate how these generational traits intersect with culture and individual variance.
Gender gap
Human capital theory attributes the gender gap in income to differences in education and experience [25, pp. 235-255]. The labor market's competitiveness impacts income and job opportunities for both genders. Furthermore, it was noted that women are less likely to enter competitive roles, often being funneled into lower-wage industries [10, p. 1-11]. Men, on the other hand, have greater access to high-paying sectors. A study [28, pp. 35-51] found that 60% of female applicants accept lower-than-expected salaries, compared to 56% of male applicants. This suggests that market competitiveness disproportionately influences women to accept lower wages.Methodology
This study employs a quantitative research method, utilizing secondary data from the Russian job portal Headhunter (hh.ru). The dataset includes both numeric and categorical variables, aimed at identifying individual characteristics that influence applicants to include salary expectations in their online resumes.
Sample description
Data for this study were sourced from Headhunter (hh.ru), a leading job search portal in Russia and the CIS countries. The platform serves as a bridge between jobseekers and employers, offering various services centered around recruitment needs. Our sample comprises 30,056 anonymous resumes, which include information such as Year of Birth, Gender, Generation, Education Level, Salary Expectation, number of skills, and work experience. Descriptive statistics are provided in Table 1.|
|
|
Frequency
|
Percent
|
|
Gender
|
Female
|
19796
|
65.9
|
|
Male
|
10260
|
34.1
| |
|
Total
|
30056
|
100.0
| |
|
Generation
|
Silent
Generation
|
5
|
.0
|
|
Baby
Boomers
|
2382
|
7.9
| |
|
Generation
X
|
13341
|
44.4
| |
|
Generation
Y
|
13939
|
46.4
| |
|
Generation
Z
|
389
|
1.3
| |
|
Total
|
30056
|
100
| |
|
Educational
Level
|
Higher
Education
|
25201
|
83.8
|
|
Bachelors’
Degree
|
658
|
2.2
| |
|
Masters’
Degree
|
1002
|
3.3
| |
|
Ph.
D. (Candidate of Science)
|
699
|
2.3
| |
|
Doctor
of Science
|
43
|
.1
| |
|
Incomplete
Higher Studies
|
1354
|
4.5
| |
|
Secondary
Education
|
244
|
.8
| |
|
Specialized
Secondary Education
|
855
|
2.8
| |
|
Total
|
30056
|
100.0
|
Materials and Procedures
The initial step in our analysis involved examining data on applicants who omitted salary expectations. A dummy variable was created: '0' for those without salary expectations and '1' for those with. Secondly, applicants were grouped by year of birth into three generational categories (X, Y, Z) using generational theory. We excluded the Silent Generation and Baby Boomers, as 41.5% were above Russia's retirement age of 60 for women and 65 for men. This led to a final sample size of 27,669 applicants. 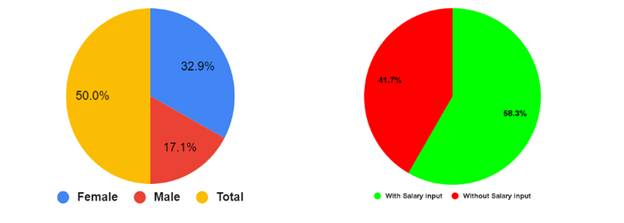
Figure 2: Gender and Salary expectation (Compiled by Authors)
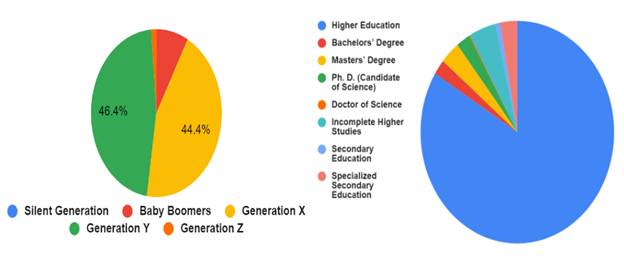
Figure 3: Generations and Education (Compiled by Authors)
Finally, the number of skills and working experiences variables are consisted with the amount of skill and duration of working in moth. The number of skill variable is only a number that individuals possessed. Table 2 gives the description of all the variables.
|
Variable
|
Description
|
Class of Variable
|
Measurement
|
|
Input
Salary Expectation
|
Applicants who put and who do not put their salary
expectations on their profile hh.ru website
|
Binary
|
0 = Without Salary Expectation
1 = With Salary Expectation |
|
The
Number of Skill
|
Total number of skills that applicants mentioned
on their profile on hh.ru website
|
Numeric
|
Number
of skills
|
|
The
Working Experiences
|
This variable is about the duration previous
working of the applicant in the months
|
Numeric
|
Number
of months
|
|
Generation
|
This variable is about the generation. The
generation classified by 3. they are generation X, generation Y, generation
Z.
|
Ordinal
|
1 = Generation X
2 = Generation Y 3 = Generation Z |
|
Educational
level
|
This variable is about the level of education that
applicant put in the online application form. It is classified based on the
actual number of educational levels taken by applicants
|
Ordinal
|
Higher education (1), masters (3) degree,
bachelor’s degree (2), Ph. D (Candidate of Science) (4), Doctor of science
(5), Incomplete higher studies (6), Secondary education (7), and
Working-class position (8)
|
|
Gender
|
Male
and female
|
Categorical
|
1
= male, 0 = female
|
Data analysis was performed using IBM SPSS 24, a comprehensive tool for statistical and machine learning analyses. Initially, T-tests were conducted to compare average values of numeric variables like skills and work experience against the presence or absence of salary expectations. Subsequently, logistic regression was applied to explore the relationship between salary expectations and other variables.
Result of Analysis
To address the research question, two analyses were conducted. First, a T-test compared the number of skills and duration of work experience between applicants with and without salary expectations. This helped identify significant differences in these characteristics. Second, three logistic regression models were utilized to examine the relationship between applicants' individual attributes (education level, skills, gender, and work experience) and their inclination to include salary expectations in their resumes.
T-test for Comparison Analysis
Table 3 illustrated the statistical value of the variable, namely, the number of skills and working experiences. The number of skills was about eleven (M = 11.27, SD = 9.19) for applicants without salary expectation and nine (M = 9.11, SD = 9.37) for applicants with salary expectation. The working experience was about one hundred and sixty (M = 160.59, SD = 79.05) for applicants without salary expectation and one hundred and fifty-eight (M = 158.28, SD = 78.19) for applicants with salary expectation.|
Variable |
Input
Salary Expectation
|
N
|
Mean
|
Std. Deviation
|
Std. Error Mean
|
|
The
Number of Skill
|
Without
Salary Expectation
|
11536
|
11.27
|
9.191
|
.086
|
|
With
Salary Expectation
|
16133
|
9.11
|
9.368
|
.074
| |
|
Working
Experiences
|
Without
Salary Expectation
|
11536
|
160.59
|
79.052
|
.736
|
|
With
Salary Expectation
|
16133
|
158.28
|
78.188
|
.616
|
Table 4 reveals key findings. For the number of skills, Levene's Test indicates a p-value of 0.020, less than the 0.05 threshold, suggesting non-homogeneous data variances across groups. The t-test shows a significant difference between applicants with and without salary expectations (t(27667) = 19.039, p = 0.000).
In contrast, the working experience data is homogeneous, as evidenced by Levene's Test (p = 0.962). The t-test still reveals a significant difference between the two applicant groups (t(27667) = 2.410, p = 0.016).
|
|
Levene's
Test for Equality of Variances
|
t-test
for Equality of Means
| ||||||||
|
F
|
Sig.
|
t
|
df
|
Sig.
(2-tailed) |
Mean
Difference
|
Std.
Error Difference
|
95%
Confidence Interval of the Difference
| |||
|
Lower
|
Upper
| |||||||||
|
The Number of Skill
|
Equal variances
assumed
|
5.443
|
.020
|
19.039
|
27667
|
.000
|
2.158
|
.113
|
1.935
|
2.380
|
|
Equal variances not
assumed
|
19.099
|
25124.390
|
.000
|
2.158
|
.113
|
1.936
|
2.379
| |||
|
Working Experiences
|
Equal variances
assumed
|
.002
|
.962
|
2.410
|
27667
|
.016
|
2.308
|
.958
|
.431
|
4.186
|
|
Equal variances not
assumed
|
2.406
|
24681.533
|
.016
|
2.308
|
.960
|
.428
|
4.189
| |||
Logistic Regression
Three different models were used to investigate the difference between each model. In the first model, the number of skills, and the education level of the applicant were predictor variables. In the second model, generation and gender variables were added, and in the last model, working experience was added in the logistic regression analytics.Model 1. The number of skill and education
The initial model examined two variables: education and the number of skills. Two measures, Cox & Snell R Square and Nagelkerke R Square, were used to gauge explained variation, yielding values of 0.20 and 0.027 respectively. According to Table 5 in the appendix, the model correctly classified 57.1% of the cases. It performed better for applicants including salary expectations (88.3%) than for those without (13.5%).
|
|
Observed |
Predicted
| |||
|
Input Salary Expectation
|
Percentage Correct
| ||||
|
Without Salary Expectation
|
With Salary Expectation
| ||||
|
Step
1
|
Input
Salary Expectation
|
Without
Salary Expectation
|
1559
|
9977
|
13.5
|
|
With
Salary Expectation
|
1882
|
14251
|
88.3
| ||
|
Overall
Percentage
|
|
|
57.1
| ||
|
a.
The cut value is .500
| |||||
Table 6 presents the logistic regression results for education level and skills as predictors of salary expectation inclusion. Significant findings were observed for the number of skills and all education levels except secondary education. Specifically, skills (p < 0.0001) and most education levels (p < 0.05) were significant predictors, while secondary education was not (p = 0.952).
The odds ratio for skills was 0.978, indicating a 2.2% decrease in the odds of including salary expectations for each additional skill. In contrast, secondary education had an odds ratio of 1.01, showing a 1% increase in the odds, though this was statistically insignificant. Due to its limited population, the result for secondary education was disregarded. Thus, Hypothesis 1 was accepted, affirming that education and skills significantly influence the inclusion of salary expectations in online resumes.
|
|
B
|
S.E.
|
Wald
|
df
|
Sig.
|
Exp(B)
| |
|
Step
1a
|
The
Number of Skill
|
-.022
|
.001
|
269.331
|
1
|
.000
|
.978
|
|
Education
|
|
|
187.369
|
7
|
.000
|
| |
|
Higher
Education
|
-.722
|
.082
|
77.539
|
1
|
.000
|
.486
| |
|
Bachelors’
Degree
|
-.411
|
.117
|
12.368
|
1
|
.000
|
.663
| |
|
Masters’
Degree
|
-.825
|
.104
|
63.454
|
1
|
.000
|
.438
| |
|
Ph.
D (Candidate of Science)
|
-1.019
|
.116
|
76.832
|
1
|
.000
|
.361
| |
|
Doctor
of Science
|
-1.131
|
.484
|
5.467
|
1
|
.019
|
.323
| |
|
Incomplete
Higher Studies
|
-.225
|
.101
|
4.972
|
1
|
.026
|
.798
| |
|
Secondary
Education
|
.010
|
.172
|
.004
|
1
|
.952
|
1.010
| |
|
Constant
|
1.237
|
.081
|
230.836
|
1
|
.000
|
3.446
| |
|
a.
Variable(s) entered on step 1: The Number of Skill, Education consist with
(Higher Education, Bachelors’ Degree, Masters’ Degree, Ph. D (Candidate of
Science), Doctor of Science, Incomplete Higher Studies, Secondary Education.
| |||||||
Model 2. The number of skills, education, generation, and gender
The second logistic regression model incorporated four variables: education, skills, generation, and gender. The explained variation was quantified by Cox & Snell R Square and Nagelkerke R Square, with values of 0.022 and 0.030, respectively. The model correctly classified 58.6% of cases. Specifically, 89.2% of applicants who included salary expectations were correctly classified, compared to 15.8% for those who did not.
|
|
Observed |
Predicted
| |||
|
Input Salary Expectation
|
Percentage Correct
| ||||
|
Without Salary Expectation
|
With Salary Expectation
| ||||
|
Step
1
|
Input
Salary Expectation
|
Without
Salary Expectation
|
1822
|
9714
|
15.8
|
|
With
Salary Expectation
|
1739
|
14394
|
89.2
| ||
|
Overall
Percentage
|
|
|
58.6
| ||
|
a.
The cut value is .500
| |||||
Table 8 revealed that while Generation X (p = 0.282) and Generation Y (p = 3.25) were not statistically significant in influencing salary expectations, gender (p = 0.00) was significant. The odds ratios for Generations X and Y were similar, at 1.142 and 1.121 respectively, suggesting little generational influence on salary expectations. This led to the acceptance of the alternative hypothesis (H3a), affirming that age differences don't significantly affect the likelihood of including salary expectations in job applications.
On the gender front, the odds ratio was 0.80 (p < 0.05), indicating that males were 20% less likely than females to include salary expectations in their resumes. This supports Hypothesis 4, confirming that gender significantly influences the inclusion of salary expectations on job search platforms.
|
|
B
|
S.E.
|
Wald
|
df
|
Sig.
|
Exp(B)
| |
|
Step
1a
|
The
Number of Skill
|
-.021
|
.002
|
81.469
|
1
|
.000
|
.979
|
|
Education
|
|
|
185.256
|
7
|
.000
|
| |
|
Higher
Education
|
-.728
|
.083
|
77.576
|
1
|
.000
|
.483
| |
|
Bachelors’
Degree
|
-.421
|
.117
|
12.909
|
1
|
.000
|
.657
| |
|
Masters’
Degree
|
-.829
|
.104
|
63.407
|
1
|
.000
|
.437
| |
|
Ph.
D (Candidate of Science)
|
-1.005
|
.117
|
74.108
|
1
|
.000
|
.366
| |
|
Doctor
of Science
|
-1.176
|
.483
|
5.927
|
1
|
.015
|
.308
| |
|
Incomplete
Higher Studies
|
-.205
|
.101
|
4.123
|
1
|
.042
|
.814
| |
|
Secondary
Education
|
.026
|
.172
|
.022
|
1
|
.881
|
1.026
| |
|
Generation
|
|
|
1.161
|
2
|
.560
|
| |
|
Generation
X
|
.133
|
.124
|
1.157
|
1
|
.282
|
1.142
| |
|
Generation
Y
|
.114
|
.116
|
.970
|
1
|
.325
|
1.121
| |
|
Male
|
-.221
|
.026
|
71.007
|
1
|
.000
|
.801
| |
|
Constant
|
1.253
|
.133
|
88.702
|
1
|
.000
|
3.501
| |
|
a.
Variable(s) entered on step 1: The Number of Skill, Education consist with
(Higher Education, Bachelors’ Degree, Masters’ Degree, Ph. D (Candidate of
Science), Doctor of Science, Incomplete Higher Studies, Secondary Education,
Generation consist with Generation X and Generation Y, Gender consist with
Male.
| |||||||
Authors)
Model 3. The number of skills, education, generation, gender, and working experiences
The final model analyzed five factors: education, skill level, generation, gender, and work experience. According to the Cox & Snell and Nagelkerke R Square values (0.023 and 0.030), the model correctly classified 58.1% of the cases. In this classification, 89.0% of applicants who included salary expectations were correctly identified, compared to 14.8% for those who did not. The model showed a slight improvement of 1% in one category and a minor reduction of 0.5% in another compared to the previous model.
|
|
Observed |
Predicted
| |||
|
Input Salary Expectation
|
Percentage Correct
| ||||
|
Without Salary Expectation
|
With Salary Expectation
| ||||
|
Step
1
|
Input Salary Expectation |
Without
Salary Expectation
|
1704
|
9832
|
14.8
|
|
With
Salary Expectation
|
1770
|
14363
|
89.0
| ||
|
Overall
Percentage
|
|
|
58.1
| ||
|
a.
The cut value is .500
| |||||
Table 10 reveals that work experience is not a significant factor in influencing applicants to include salary expectations in their resumes (exp (0.000) = 1.00, p > 0.05). The odds ratio stands at 1.00, indicating no discernible difference between the groups of applicants who do and do not include salary expectations. As a result, the alternative hypothesis H2a is accepted, affirming that work experience doesn't significantly impact the inclusion of salary expectations on job search websites.
|
|
B
|
S.E.
|
Wald
|
df
|
Sig.
|
Exp(B)
| |
|
Step
1a
|
The
Number of Skill
|
-.021
|
.002
|
81.814
|
1
|
.000
|
.979
|
|
Education
|
|
|
184.044
|
7
|
.000
|
| |
|
Higher
Education
|
-.727
|
.083
|
77.339
|
1
|
.000
|
.484
| |
|
Bachelors’
Degree
|
-.428
|
.117
|
13.340
|
1
|
.000
|
.652
| |
|
Masters’
Degree
|
-.832
|
.104
|
63.783
|
1
|
.000
|
.435
| |
|
Ph.
D (Candidate of Science)
|
-1.003
|
.117
|
73.729
|
1
|
.000
|
.367
| |
|
Doctor
of Science
|
-1.176
|
.483
|
5.920
|
1
|
.015
|
.309
| |
|
Incomplete
Higher Studies
|
-.206
|
.101
|
4.134
|
1
|
.042
|
.814
| |
|
Secondary
Education
|
.024
|
.172
|
.019
|
1
|
.891
|
1.024
| |
|
Generation
|
|
|
1.650
|
2
|
.438
|
| |
|
Generation
X
|
.161
|
.125
|
1.649
|
1
|
.199
|
1.174
| |
|
Generation
Y
|
.142
|
.118
|
1.463
|
1
|
.226
|
1.153
| |
|
Male
|
-.221
|
.026
|
70.925
|
1
|
.000
|
.801
| |
|
Working
Experiences
|
.000
|
.000
|
2.115
|
1
|
.034
|
1.000
| |
|
Constant
|
1.262
|
.133
|
89.798
|
1
|
.000
|
3.534
| |
|
a.
Variable(s) entered on step 1: The Number of Skill, Education consist with
(Higher Education, Bachelors’ Degree, Masters’ Degree, Ph. D (Candidate of
Science), Doctor of Science, Incomplete Higher Studies, Secondary Education,
Generation consist with Generation X and Generation Y, Gender consist with
Male, Working Experiences.
| |||||||
From all results of analysis, the authors can conclude the analysis with the Figure 4. The factor can influence applicant decisions to include salary expectation are the educational level and skill of applicant (H1) working experiences of applicant (H2) and the gender of applicant (H4) because these characteristics have significant result (p < 0.05). The hypothesis for generation (H3) is rejected as the result was insignificant (p > 0.05).
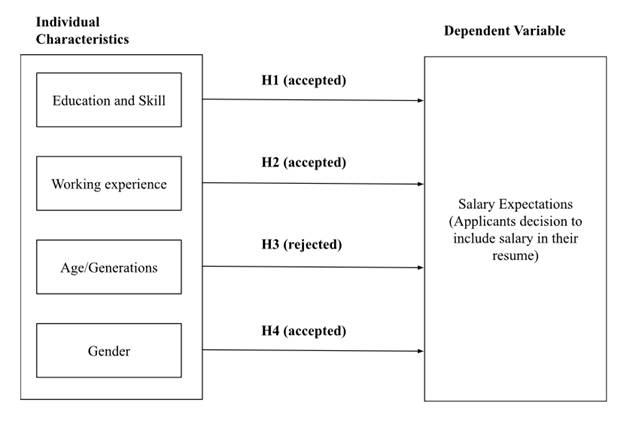
Figure 4. Result of Analysis (Compiled by Authors)
Discussion
The primary aim of this research is to investigate what influences applicants' choices to include or omit salary expectations on their resumes. We scrutinized variables such as educational level, skill set, work experience length, and age, segmented by generational categories. Initial T-tests on skill count and work experience revealed these to be statistically significant factors in this decision-making process.
Applicants with more extensive work experience and a greater skill set tend to avoid specifying salary expectations on resumes, a finding in line with prior research [5]. One main reason is the quest for flexibility in salary negotiations. Such applicants often target positions that pay better than their current roles and expect salary offers to match their qualifications. By not listing a specific salary expectation, they believe they leave room for better negotiation. Another influencing factor could be their educational background. For example, those with economics degrees may focus more on career growth [31].
Additionally, stating an expected salary could give the impression that applicants prioritize financial gain over job opportunities. The fear of receiving a subpar offer also discourages them from mentioning salary expectations. They aim to sidestep seeming overvalued or undervalued. Various factors, including gender and family income, play a role in shaping both actual and expected salaries [13, pp. 805-813]. According to human capital theory, earnings expectations should naturally rise as one accumulates more experience and skills [6]. Yet, interestingly, those with significant skills and experience often opt to omit salary expectations from their resumes, despite anticipating better pay than their less-experienced counterparts.
On the flip side, applicants who are less skilled and have limited work experience tend to include salary expectations in their resumes. This group is largely made up of recent college graduates or those with fewer educational credentials. Several elements contribute to this choice. One is the need to align job offers with their known financial requirements, as they have a good grasp of their living expenses [33]. Interestingly, this cohort may also be willing to accept lower salaries if they deem the job to offer meaningful work, reinforcing the idea that the nature of work can sometimes sound financial considerations [15]. This pattern corroborates earlier research indicating that individuals less willing to invest in building human capital are typically content with lower salaries [7, pp. Xvi, 187].
Logistic regression analysis indicates that education, skill set, and gender are significant in determining whether applicants include salary expectations in resumes. Specialized secondary education, the lowest in the Bologna system, had no significant impact. This could stem from these applicants' lack of confidence and skills, making them less inclined to specify salary expectations. Employers generally favor higher-educated and more skilled candidates for better-paying roles.
Candidates with Ph.D. qualifications notably influence salary expectations, likely due to their extensive skills and experience, making them more confident to ask for higher salaries. [11] also highlight the role of individual factors like age and motivation on salary expectations. This study found no significant impact of generational age differences, corroborating [14, pp. 1-10], who suggest that generational work motivations do not necessarily influence salary expectations.
The labor market's role is also crucial, especially concerning gender differences in income [10, pp, 1-11]. Our data supports this, revealing that gender significantly affects the decision to include salary expectations, with women more likely to do so despite often receiving lower salaries than their expectations [28, pp. 35-51].
Surprisingly, the length of work experience did not significantly impact the decision to include or omit salary expectations. This contrasts with existing research suggesting work experience influences various aspects of professional life, such as salary expectations [5], productivity [36, pp. 788-807], and job commitment [2, pp. 26-33].
Theoretical and Practical Implications
The study builds on the work of Mincer and Becker, contributing both theoretically and practically to human capital theory. We focus on why individuals include salary expectations in resumes, extending human capital theory by examining individual characteristics like education, experience, age, and gender and their impact on salary expectations.
Regionally, our study is significant for human capital theory development in Russia. While extensive research exists in the U.S., we aim to broaden the understanding of this theory within the Russian context.
Practically, our findings benefit companies and recruiters. By analyzing resumes on job platforms, employers can focus on candidates specifying salary expectations, which often align with their qualifications and experience. This data can help employers identify candidates who meet job requirements and have realistic salary expectations, particularly for challenging roles requiring specific skills and experience.
Education is pivotal for career development. Those with higher educational levels often possess specialized skills compared to those with lower educational backgrounds. Work experience also enriches an individual's professional competencies, offering benefits like skill development and deeper work process understanding.
Gender plays a critical role in the labor market, where both men and women compete for jobs. Our study shows women are more likely to state salary expectations, possibly due to the existing gender pay gap. Supporting this, [28, pp. 35-51] found that women are more inclined to accept lower salaries than their initial expectations. Therefore, we recommend that women familiarize themselves with salary benchmarks in their target roles for effective negotiation.
What is the importance of salary expectation?
First, stating salary expectations serves as a self-assessment tool for applicants. It helps gauge market value based on education, skills, and experience. Understanding industry salary standards is crucial when job-hunting. Second, including salary expectations can increase interview chances. Employers, often constrained by budgets, prefer candidates whose salary expectations align with theirs. Thus, specifying salary expectations can be beneficial for both employers and jobseekers as a filtering tool. Lastly, salary expectations play a role during the negotiation phase. Employers discuss these during interviews to see if an applicant's financial goals align with the company's budget and the job's responsibilities. Some applicants may secure a salary that meets or exceeds their expectations, while others may settle for less. Therefore, it's crucial for applicants to be prepared to negotiate salaries effectively during interviews.
Limitation and Further Research
Firstly, a notable limitation of this study is the scant literature examining the factors that influence an applicant's decision to include salary expectations in their resume. Secondly, our research focuses solely on the duration of work experience, lacking detailed insights into the nature and scope of applicants' previous roles. Thirdly, while we analyze the number of skills applicants possess, the study does not delve into specifics such as IT skills or language proficiency. Lastly, the geographic scope of this research is confined to the Saint Petersburg region, potentially limiting its generalizability.
For future research, we recommend extending the study to different geographic locations and incorporating more detailed information on skills and work experience, such as the name of the company, sector, and previous job positions. Such an approach would not only allow for a broader comparison of results across regions but also enable future comparative analyses.
Conclusion
The study identifies two main categories influencing salary expectations: job-related factors like task complexity and specialized knowledge [3, pp. 129-142], and individual traits such as age, seniority, motivation [11], gender [10, pp. 1-11], education, and skills [21].
Key determinants for including salary expectations in resumes are skills, educational level, work experience, and gender. Higher education often equates to specialized job knowledge and competence. Skills enable efficient task completion, while work experience offers benefits like skill development and deeper role understanding. Gender is also influential, likely due to disparities in workplace amenities and benefits.
Surprisingly, generational differences don't significantly affect the decision to specify salary expectations in resumes. This implies that age may impact the scale of salary expectations but doesn't necessarily influence the choice to disclose them on a resume.
Источники:
2. Ahluwalia A. K., Preet K. Work Motivation, Organizational Commitment and Locus of Control vis-a-vis Work Experience amongst University Teachers // SIBM Pune Research Journal. – 2017. – № 14. – p. 26-33. – doi: 10.12691/ajnr-7-2-8.
3. Alsulami H. The Effect of Education and Experience on Wages: The Case Study of Saudi Arabia // American Journal of Industrial and Business Management. – 2018. – № 8. – p. 129-142. – doi: 10.4236/ajibm.2018.81008.
4. Arora P., Kshatriya K. P. Millennials: The New Generation with High Employment Expectations // International Journal of Advance Research in Computer Science and Management Studie. – 2017. – № 5(8). – p. 101-109.
5. Baltes P. B. On the incomplete architecture of human ontogeny: Selection, optimization, and compensation as foundation of developmental theory // American psychologist. – 1997. – № 52(4). – p. 366.
6. Becker G. S. Human Capital: A Theoretical and Empirical Analysis, with Special Reference to Education. / 3rd edition. - New York: National Bureau of Economic Research and Columbia University Press, 1993.
7. Becker Gary S. Human Capital: A Theoretical and Empirical Analysis, with Special Reference to Education. - New York: National Bureau of Economic Research, 1964. – Xvi, 187 p.
8. Buzza J. S. Are You Living to Work or Working to Live? What Millennials Want in the Workplace // Journal of Human Resources Management and Labor Studies. – 2017. – № 5(2). – p. 15-20. – doi: 10.15640/jhrmls.v5n2a3.
9. Calk R., Patrick A. Millennials Through The Looking Glass: Workplace Motivating Factors // The Journal of Business Inquiry. – 2017. – № 16(2). – p. 131-139.
10. Dasgupta U., Mani S., Sharma S., And Singhal S. Can gender differences in distributional preferences explain gender gaps in competition? // Journal of Economic Psychology. – 2019. – № 70. – p. 1-11. – doi: 10.1016/j.joep.2018.10.013.
11. Duarte H., de Eccher U., Brewster C. Expatriates' salary expectations, age, experience and country image // Personnel Review. – 2020. – doi: 10.1108/PR-05-2019-0229.
12. Duta A., Wielgoszewska B., Iannelli C. Different degrees of career success: social origin and graduates’ education and labour market trajectories // Advances in Life Course Research. – 2020. – p. 1-11. – doi: 10.1016/j.alcr.2020.100376.
13. Eliophotou Menon Maria, Pashourtidou Nicoletta, Polycarpou Alexandros, Pashardes Panos Students’ expectations about earnings and employment and the experience of recent university graduates: Evidence from Cyprus // International Journal of Educational Development. – 2012. – № 32. – p. 805–813. – doi: 10.1016/j.ijedudev.2011.11.011.
14. Heyns M. M., Kerr M. D. Generational differences in workplace motivation // SA Journal of Human Resource Man. – 2018. – № 16(01). – p. 1-10. – doi: 10.4102/sajhrm.v16i0.967.
15. Hu J., Hirsh J. B. Accepting Lower Salaries for Meaningful Work // Front. Psychol. – 2017. – № 8. – p. 1649.
16. Humburg M., Grip A. D., Velden R. V. D. Which skills protect graduates against a slack labour market? // International Labour Review. – 2017. – № 156(1). – p. 25-43. – doi: 10.1111/j.1564-913X.2015.00046.x.
17. Junankar P. R. Economics of the Labour Market: Unemployment, Long-Term Unemployment and the Costs of Unemployment. - Palgrave Macmillan, 2016.
18. Kerr O. K., Pekkarinen T., Sarvimaki M., Uusitalo R. Post-secondary education and information on labor market prospects: A randomized field experiment // Labour Economics. – 2020. – № 66. – p. 1-14. – doi: 10.1016/j.labeco.2020.101888Get.
19. Kim E. H., Kim H., Li Y., Lu Y., Shi X. Equity Offerings, Technology, and Employee Skill Composition // SSRN Electronic Journal. – 2018. – p. 1-60.
20. Lisa E., Hennelova K., Newman D. Comparison between Employers' and Students' Expectations in Respect of Employability Skills of University Graduates // International Journal of Work-Integrated Learning. – 2019. – № 20(1). – p. 71-82.
21. Liu S., Yang X. Human capital externalities or consumption spillovers? The effect of high-skill human capital across low-skill labor markets // Regional Science and Urban Economics. – 2021. – № 87. – doi: 10.1016/j.regsciurbeco.2020.103620.
22. Oswald-Egg M. E., Ursula R. No experience, no employment: The effect of vocational education and training work experience on labour market outcomes after higher education // Economics of Education Review. – 2021. – № 80. – p. 1-33. – doi: 10.1016/j.econedurev.2020.102065.
23. Paolo A. D., Tansel A. English skills, labour market status and earnings of Turkish women // Empirica. – 2019. – № 46. – p. 669–690. – doi: 10.1007/s10663-019-09434-9.
24. Park S., Park S. Exploring the generation gap in the workplace in South Korea // Human Resource Development International. – 2017. – № 21(3). – p. 276-283. – doi: 10.1080/13678868.2017.1306769.
25. Peetz D., Murray G. The persistence of gender gaps. / In book: Women, Labor Segmentation and Regulation., 2017. – 235-255 p.
26. Petrovic M. D., Deri L., Markovic J. J., Galambos A., Galambos T., Jovicic A. Educational Level Differences in Job Satisfaction and Service Orientation: Case of Hotels in Novi Sad (Serbia) // International Journal of Business Tourism and Applied Scieces. – 2013. – № 1(02). – p. 21-29.
27. Pursiainen Christer, Medvedev Sergey A., Belov Valeriy A. The Bologna Process and Its Implications for Russia : The European Integration of Higher Education. - RECEP, 2005.
28. Säve-Söderbergh J. Gender gaps in salary negotiations: Salary requests and starting salaries in the field // Journal of Economic Behavior and Organization. – 2019. – № 161. – p. 35-51. – doi: 10.1016/j.jebo.2019.01.019.
29. Schmid S., Altfeld F. International work experience and compensation: Is more always better for CFOs? // European Management Journal. – 2017. – № 36(04). – p. 530-543. – doi: 10.1016/j.emj.2017.11.001.
30. Schultz T. Education and productivity. - Washington, DC: National Commission on Productivity, 1971.
31. Jana Šimsová, Alice Reissová How much will I earn? Expectations versus reality // E+M Ekonomie a Management. – 2016. – № 19(2). – p. 4-20. – doi: 10.15240/tul/001/2016-2-001.
32. Suutari V., Brewster C., Mäkelä L., Dickmann M., Tornikoski C. The effect of international work experience on the career success of expatriates: A comparison of assigned and self‐initiated expatriates // Human Resource Management. – 2018. – № 57(1). – p. 37-54.
33. Taylor Dorceta Employment Preferences and Salary Expectations of Students in Science and Engineering // Bioscience. – 2007. – № 57. – doi: 10.1641/B570212.
34. Verhofstadt E., Witte H. D., Omey E. Higher educated workers: better jobs but less satisfied? // International Journal of Manpower. – 2007. – № 28 (2). – p. 135-151. – doi: 10.1108/01437720710747965.
35. Virk H. K. Effect of Experience and Educational Level on Job Satisfaction of Telecom Executives // Management and Labour Studies. – 2012. – № 37(3). – p. 209-217. – doi: 10.1177/0258042X13484835.
36. Weiss F., Klein M., Grauenhorst T. The effects of work experience during higher education on labour market entry: learning by doing or an entry ticket? // Work, employment and society. – 2014. – № 28(5). – p. 788-807.
37. Yang X., Gao J., Liu J. H., Zhou T. Height conditions salary expectations: Evidence from large-scale data in China // Physica A: Statistical Mechanics and its Applications. – 2018. – № 501. – p. 86-97.
Страница обновлена: 15.07.2026 в 11:05:08
Download PDF | Downloads: 41
Влияние особенностей человеческого капитала на зарплатные ожидания: исследование рынка труда Санкт-Петербург
Mahar D.H., Ramadhani B.Y.Journal paper
Russian Journal of Labour Economics
Volume 10, Number 11 (November 2023)
Abstract:
Человеческие характеристики действительно влияют на решения людей во всех аспектах жизни. Целью данного исследования является анализ характеристик, которые могут повлиять на решение соискателей включить свои зарплатные ожидания в свое резюме при подаче заявления на новую должность. В частности, сюда входят уровень образования, опыт работы, возрастные и гендерные различия. Данные были собраны с одного из ведущих российских порталов вакансий HH.ru. Набор данных состоял из претендентов, подавших заявки на руководящие должности. Для изучения этих переменных и их связи с ожиданиями заработной платы были использованы два разных метода анализа. Анализ Т-теста использовался для сравнения средних значений переменных. На втором этапе были использованы 3 модели логистического регрессионного анализа с различной комбинацией переменных для изучения взаимосвязей и их влияния. Наше исследование показало значительное влияние уровня образования и навыков, опыта работы и пола на ожидания по заработной плате. Авторы пришли к выводу, что люди с большим количеством навыков, опыта работы и более высоким уровнем образования, как правило, не упоминают в резюме свои зарплатные ожидания, и наоборот. Это исследование может быть полезно работодателям, занимающимся персоналом, которые хотят нанять новых сотрудников.
Keywords: зарплатные ожидания, рынок труда, опыт работы, навыки, уровень образования, гендерный разрыв
JEL-classification: J21, J23, J24, J31, J32, J33, J38
References:
Acheampong N. A. A. (2020). Reward Preferences of the Youngest Generation: Attracting, Recruiting, and Retaining Generation Z into Public Sector Organizations Compensation & Benefits Review. 1-23. doi: 10.1177/0886368720954803.
Ahluwalia A. K., Preet K. (2017). Work Motivation, Organizational Commitment and Locus of Control vis-a-vis Work Experience amongst University Teachers SIBM Pune Research Journal. (14). 26-33. doi: 10.12691/ajnr-7-2-8.
Alsulami H. (2018). The Effect of Education and Experience on Wages: The Case Study of Saudi Arabia American Journal of Industrial and Business Management. (8). 129-142. doi: 10.4236/ajibm.2018.81008.
Arora P., Kshatriya K. P. (2017). Millennials: The New Generation with High Employment Expectations International Journal of Advance Research in Computer Science and Management Studie. (5(8)). 101-109.
Baltes P. B. (1997). On the incomplete architecture of human ontogeny: Selection, optimization, and compensation as foundation of developmental theory American psychologist. (52(4)). 366.
Becker G. S. (1993). Human Capital: A Theoretical and Empirical Analysis, with Special Reference to Education
Becker Gary S. (1964). Human Capital: A Theoretical and Empirical Analysis, with Special Reference to Education
Buzza J. S. (2017). Are You Living to Work or Working to Live? What Millennials Want in the Workplace Journal of Human Resources Management and Labor Studies. (5(2)). 15-20. doi: 10.15640/jhrmls.v5n2a3.
Calk R., Patrick A. (2017). Millennials Through The Looking Glass: Workplace Motivating Factors The Journal of Business Inquiry. (16(2)). 131-139.
Dasgupta U., Mani S., Sharma S., And Singhal S. (2019). Can gender differences in distributional preferences explain gender gaps in competition? Journal of Economic Psychology. (70). 1-11. doi: 10.1016/j.joep.2018.10.013.
Duarte H., de Eccher U., Brewster C. (2020). Expatriates' salary expectations, age, experience and country image Personnel Review. doi: 10.1108/PR-05-2019-0229.
Duta A., Wielgoszewska B., Iannelli C. (2020). Different degrees of career success: social origin and graduates’ education and labour market trajectories Advances in Life Course Research. 1-11. doi: 10.1016/j.alcr.2020.100376.
Eliophotou Menon Maria, Pashourtidou Nicoletta, Polycarpou Alexandros, Pashardes Panos (2012). Students’ expectations about earnings and employment and the experience of recent university graduates: Evidence from Cyprus International Journal of Educational Development. (32). 805–813. doi: 10.1016/j.ijedudev.2011.11.011.
Heyns M. M., Kerr M. D. (2018). Generational differences in workplace motivation SA Journal of Human Resource Man. (16(01)). 1-10. doi: 10.4102/sajhrm.v16i0.967.
Hu J., Hirsh J. B. (2017). Accepting Lower Salaries for Meaningful Work Front. Psychol. (8). 1649.
Humburg M., Grip A. D., Velden R. V. D. (2017). Which skills protect graduates against a slack labour market? International Labour Review. (156(1)). 25-43. doi: 10.1111/j.1564-913X.2015.00046.x.
Jana Šimsová, Alice Reissová (2016). How much will I earn? Expectations versus reality E+M Ekonomie a Management. (19(2)). 4-20. doi: 10.15240/tul/001/2016-2-001.
Junankar P. R. (2016). Economics of the Labour Market: Unemployment, Long-Term Unemployment and the Costs of Unemployment
Kerr O. K., Pekkarinen T., Sarvimaki M., Uusitalo R. (2020). Post-secondary education and information on labor market prospects: A randomized field experiment Labour Economics. (66). 1-14. doi: 10.1016/j.labeco.2020.101888Get.
Kim E. H., Kim H., Li Y., Lu Y., Shi X. (2018). Equity Offerings, Technology, and Employee Skill Composition SSRN Electronic Journal. 1-60.
Lisa E., Hennelova K., Newman D. (2019). Comparison between Employers' and Students' Expectations in Respect of Employability Skills of University Graduates International Journal of Work-Integrated Learning. (20(1)). 71-82.
Liu S., Yang X. (2021). Human capital externalities or consumption spillovers? The effect of high-skill human capital across low-skill labor markets Regional Science and Urban Economics. (87). doi: 10.1016/j.regsciurbeco.2020.103620.
Oswald-Egg M. E., Ursula R. (2021). No experience, no employment: The effect of vocational education and training work experience on labour market outcomes after higher education Economics of Education Review. (80). 1-33. doi: 10.1016/j.econedurev.2020.102065.
Paolo A. D., Tansel A. (2019). English skills, labour market status and earnings of Turkish women Empirica. (46). 669–690. doi: 10.1007/s10663-019-09434-9.
Park S., Park S. (2017). Exploring the generation gap in the workplace in South Korea Human Resource Development International. (21(3)). 276-283. doi: 10.1080/13678868.2017.1306769.
Peetz D., Murray G. (2017). The persistence of gender gaps
Petrovic M. D., Deri L., Markovic J. J., Galambos A., Galambos T., Jovicic A. (2013). Educational Level Differences in Job Satisfaction and Service Orientation: Case of Hotels in Novi Sad (Serbia) International Journal of Business Tourism and Applied Scieces. (1(02)). 21-29.
Pursiainen Christer, Medvedev Sergey A., Belov Valeriy A. (2005). The Bologna Process and Its Implications for Russia : The European Integration of Higher Education
Schmid S., Altfeld F. (2017). International work experience and compensation: Is more always better for CFOs? European Management Journal. (36(04)). 530-543. doi: 10.1016/j.emj.2017.11.001.
Schultz T. (1971). Education and productivity
Suutari V., Brewster C., Mäkelä L., Dickmann M., Tornikoski C. (2018). The effect of international work experience on the career success of expatriates: A comparison of assigned and self‐initiated expatriates Human Resource Management. (57(1)). 37-54.
Säve-Söderbergh J. (2019). Gender gaps in salary negotiations: Salary requests and starting salaries in the field Journal of Economic Behavior and Organization. (161). 35-51. doi: 10.1016/j.jebo.2019.01.019.
Taylor Dorceta (2007). Employment Preferences and Salary Expectations of Students in Science and Engineering Bioscience. (57). doi: 10.1641/B570212.
Verhofstadt E., Witte H. D., Omey E. (2007). Higher educated workers: better jobs but less satisfied? International Journal of Manpower. (28 (2)). 135-151. doi: 10.1108/01437720710747965.
Virk H. K. (2012). Effect of Experience and Educational Level on Job Satisfaction of Telecom Executives Management and Labour Studies. (37(3)). 209-217. doi: 10.1177/0258042X13484835.
Weiss F., Klein M., Grauenhorst T. (2014). The effects of work experience during higher education on labour market entry: learning by doing or an entry ticket? Work, employment and society. (28(5)). 788-807.
Yang X., Gao J., Liu J. H., Zhou T. (2018). Height conditions salary expectations: Evidence from large-scale data in China Physica A: Statistical Mechanics and its Applications. (501). 86-97.