Factors facilitating and hindering the development of ESG investments in Russia
Bolonin A.I.1, Kuksov A.S.1
1 Financial University under the Government of the Russian Federation, ,
Скачать PDF | Загрузок: 45 | Цитирований: 1
Статья в журнале
Экономическая безопасность (РИНЦ, ВАК)
опубликовать статью | оформить подписку
Том 6, Номер 2 (Апрель-июнь 2023)
Эта статья проиндексирована РИНЦ, см. https://elibrary.ru/item.asp?id=54166239
Цитирований: 1
Аннотация:
Today\'s discussion about sustainable development has its roots in the 1970-s and evolving along with growing social and environmental crises. For a long time, to integrate non-financial issues into asset management processes, the financial market has experimented with various approaches, using names such as «ethical», «socially responsible» or «sustainable investment». Climate change, as one of the three global problems of mankind creates significant financial problems for the world community.
Investors are currently trying to take environmental, social and governance (ESG) into account when making investment decisions. At the same time, market participants are still little aware of the nuances of the ESG integration process, which is sometimes associated with the approach to the withdrawal of individual industries, firms and projects from the portfolio. Investors believe that corporate governance issues are critical as they directly affect profitability and, ultimately, a firm\'s dividend policy. However, few people are aware of the impact of environmental and social factors on the company\'s financial performance.
Ключевые слова: ESG investments, green investments, responsible investments, approaches to identifying investment risks
JEL-классификация: Q01, Q50, Q56
Introduction. According to investors, ESG elements taken into account by specialists in the course of investment research.
Despite the complexity of their measurement, both financial and non-financial factors that affect the subjective assessment of the company's performance are investigated to assess the value of the company. This is called the level of persuasion. The overall degree of conviction is a subjective judgment based on a deep understanding of the company's actions and the degree of its interaction with stakeholders. The level of belief of the portfolio manager and analyst studying the relevant firm is also taken into account when studying the investee.
For example, if the management or owners of a company ignore labor and environmental issues, as well as the overall social impact of the company, they are unlikely to look after the interests of minority shareholders [11]. Additional risks of this kind are taken into account when calculating the company's cost of capital.
In our opinion, Russian investors do not conduct a sufficiently thorough and large-scale study of ESG variables and do not use an integrated approach to such an analysis [9].
In Russia, preference is given to the analysis of individual ESG variables [2]. Of course, almost all Russian competitors are concerned about corporate governance and, perhaps, corporate social responsibility, because these concerns can pose a threat to minority shareholders. When it comes to environmental issues, we don't think they have a significant impact. It can be said that no one believes that environmental issues have a significant impact on investment decisions.
So, we can say the following when questioned about the broad principles of ethical investment in Russia: local investors that lack contacts or possibilities to collaborate with overseas counterparts place a greater emphasis on corporate governance issues than on environmental or social concerns.
Corporate governance concerns, according to market participants, have a long-term influence on the value of stocks and bonds [1]. In this regard, the function and professional expertise of the person in charge of making critical choices in the company's management or ownership structure receives a lot of attention throughout the investment research process.
The findings of the study show that environmental and social factors play a limited role in Russian investors' investment decisions when compared to corporate governance difficulties. Due to the danger of environmental disasters or penalties imposed on the corporation, environmental considerations can occasionally impact the price of stocks and bonds. It's worth mentioning, too, that poll respondents think social concerns are more important than environmental issues.
It is also argued that social factors have a greater impact on the company's profitability than environmental factors. However, given the short investment horizon in the Russian market, market participants simply lack knowledge about how social variables affect share prices. Investors in Russia pay as little attention to social issues as they do to environmental issues. Firms usually only discuss issues of corporate governance and social responsibility, which are not classified as «ESG».
Social issues such as the interaction between employees and their employers are becoming increasingly essential in today's world. After the implementation of pension reform in Russia, which became the topic of heated debate, the mood of both employers and employees shifted. This subject will continue to be prominent in the future months, and even in the next years, resulting in modifications to huge corporations' social programmers.
There is also the issue of data availability. It is difficult to collect the necessary information about the environmental and social responsibility of a company in the country, since there are no specialized media and expert investment analysis that could be used in decision-making.
Even if ESG data is collected, the quality of that data is likely impossible to verify without visiting the company's premises.
Currently, some Russian firms are disclosing ESG data freely, but only to foreign investors. Those that want to attract foreign capital already report on their ESG efforts in compliance with European standards. Russian asset management firms fall into the same category. With more firms sharing this information, the notion of ESG investment will become more mainstream, resulting in more local investors using this information. It will assist in the transformation of their mindset.
Simultaneously, positive developments in the disclosure of ESG data have been seen. Implementation of «comply or explain» regulations for Russian enterprises to publish their outcomes in environmental protection, social responsibility, and corporate governance, as well as other projects. The Russian Union of Industrialists and Entrepreneurs6 publishes sustainability indexes and yearly non-financial information disclosure ratings for Russian enterprises, as well as offering investors access to a platform that combines sustainability reports and integrated financial reporting. The National Association of Concessionaires and Long-Term Infrastructure Investors has created a unified database and tools for current and future investors to analyses infrastructure projects while keeping in mind sustainable development principles.
The Russian stock exchange is tiny and tightly regulated. This might explain why local investors are still hesitant to sell prosperous firms that fail to fulfil specific ESG requirements (ethical standards). Firms in the oil industry, for example, make for around half of the MSCI Russia index, while companies in the finance sector account for the other half. Given the prominence of ESG variables in these businesses, screening them will undoubtedly affect the investment portfolio and risk-adjusted returns.
If the client starts to back away from investing in these areas, they will end up with a highly volatile and focused portfolio. The choice of bonds and stocks in which to invest in Russia today is rather limited. Local Endowment Funds can only invest in companies listed on the Moscow Exchange. Most corporations in these areas have low ESG scores.
The investment horizon is another market element impeding the adoption of ESG integration in Russia. According to some, the notion of investing in ESG issues is controversial in Russian capital markets since many of its participants have a limited investment horizon. Because the significant features of ESG have a long-term impact on portfolio performance, investors who concentrate in short-term investments do not believe it is vital to examine them.
Finally, one of Russia's issues is the lack of a strong institutional investment base. Insurance firms and pension funds are frequently the driving force behind the deployment of ESG integration techniques in other countries. The Bank of Russia points out the negative implications of this situation in his document on the strategic development of the financial industry, Main directions for the growth of the financial market of the Russian Federation for the period 2019-2021. This inhibits the economy's capacity to convert people's savings into long-term investments that are required for long-term economic development and improved citizen wellbeing.
In addition to market constraints, Russian investors' lack of desire to follow ESG investment principles can be explained by a lack of understanding of the concept itself (ESG integration is often equated with «negative» screening, or the exclusion of certain industries, companies, or projects from the portfolio), as well as a lack of understanding of the impact relevant factors (particularly environmental and social) have on stock prices and profitability. Russian investors are directed solely by profitability statistics and do not always comprehend how other elements unrelated to corporate governance might improve the efficiency of capital investments.
The majority of consumers equate socially responsible investing with avoiding cigarette businesses. We have to explain here what the core of this strategy is to even staff of investment funds and endowment funds, and why it is conceivable and important to pay attention to ESG concerns in Russia.
Clients' understanding of what elements connect to ESG is also restricted, making it difficult for them to report, but having a thorough understanding of these components, whether or not they are integrated into internal processes, can help.
Some Russian asset management businesses that operate with international investors are better knowledgeable about ESG concerns and reporting on Russian companies' compliance with these regulations. It doesn't always require much effort to do so. In Russia, for example, child labor is not practiced since it is illegal under the Labor Code. To certify that the Russian firms in their portfolio meet with this condition, the investor will not need to take any particular activities or undertake an examination.
Representatives of management companies express concern about the understanding by market participants of the idea of ESG investments, as well as their lack of understanding that some of its components may already be incorporated into their financial analysis: for many years, the investment practice of the company has adhered to the idea underlying investing in ESG. Managers consider aspects of ESG to help clients manage risk more effectively, but do not use the word ESG. Obviously, they have always been concerned about corporate governance issues, and they use this factor when assessing the cost of capital of a company at an early stage of evaluation.
Foreign clients have begun to inquire about how ESG risks and opportunities of local firms are included in financial assessments by Russian management organizations, but these enquiries are not always adequately significant. Although ESG investing is a hot issue in Europe right now, we don't believe these questions are being addressed so that the customer may make a better investment decision or have a beneficial influence on Russia through their investment.
Main part. Taking into account the features of the Russian ESG investment market described and the limitations faced by country's market, we will conduct an empirical assessment of the influence of ESG factors on the value of securities of Russian companies based on an analysis of the segment not of primary securities, but of shares of Russian exchange-traded mutual funds (BPIF).
As part of our study, we will assess the impact of ESG factors on the cost of shares by conducting a correlation-regression analysis of the Russian BPIF segment based on a panel regression assessment. As part of the study, we will use the CAPM model, as well as the five-factor Fama-French model, we will carry out statistical modeling based on the EViews 10 software package.
The aforementioned regression models are traditionally used to assess the effectiveness of management of mutual investment funds (in Russia – mutual funds and BPIF, in international practice – mutual funds). Numerous studies conducted by the authors on data from both European and American markets have repeatedly confirmed the sufficient explanatory power of CAPM and the five-factor Fama-French model, which allows using these models to evaluate the actions of fund managers. In addition, a number of studies conducted by Russian authors also demonstrated results comparable to foreign ones. In the course of these studies, it was empirically confirmed that the estimated indicators of these regressions on the Russian market data are statistically significant, the quality of the regressions is acceptable for studies conducted on market data [3].
Further we’ll give a brief description of the regression models used in paper.
The CAPM model is the basic model for evaluating the performance of investment fund portfolio managers. Traditionally, it is on its basis that more complex multi-factor metrics are built, which allow, among other things, to more accurately assess the impact of certain factors (including behavioral factors, for example, the manager’s ability to successfully pick the market, i.e., the choice of assets undervalued by the market, the cost which will increase in the future; or other behavioral factors). On the basis of CAPM, Jensen's alpha (α) [7] based on the concept of excess return CAPM model is built:
![]() (1)
(1)
Where, r – portfolio return;
rf – risk free return;
rm –return on market portfolio;
βp – the market risk level of portfolio.
The five-factor Fama-French model, developed in 1993, supplemented the original Jensen metric with four additional factors: SMB (Small minus Big) and HML (High minus Low), RMW (Robust Minus Weak), and CMA (Conservative Minus Aggressive), which, as a result, made it possible to significantly improve the quality of the predictive abilities of the regression and to better assess the level of significance, as well as the statistical influence of the model variables [6]:
![]() (2)
(2)
Where, SMB is the size factor, defined as the difference between the returns of small and large cap companies;
HML – the difference in the profitability of shares of companies with a high and low ratio of book value and market value;
RMW is the difference between the income of firms with high and low operating profit;
CMA is calculated as the difference between the returns of companies with a conservative investment strategy and companies with an aggressive investment strategy.
Accordingly, the coefficients for the considered variables make it possible to assess the degree of their influence on the final rate of return of the investment portfolio.
As part of this paper, we will try to assess the degree of influence of ESG factors on the profitability of mutual fund units, therefore, we believe that a factor reflecting the influence of ESG investment strategies can be added to the CAPM model and the five-factor Fama-French (FF5) model – in our case, this is the LML factor (the method of calculating this factor is given below).
Earlier it was noted that the use of ESG factors for assessing the impact on the value of individual companies is not appropriate due to the lack of uniform methods for assessing ESG ratings, and also due to the fact that even the available ratings are calculated for an extremely small number of Russian companies (the RAEX-Europe rating agency calculates ESG ratings for only 160 Russian issuers). As a result, we believe that it is irrational to conduct an assessment based on ratings for such a small number of companies, since the results obtained cannot be objectively interpreted in relation to the market of Russian issuers (or a part of it) that disclose ESG reporting.
For this reason, below we will evaluate the impact of ESG factors specifically on the value of BPIF shares. Taking into account the fact that there are practically no funds on the Russian market whose trust management rules state that these funds belong to the ESG category, based on the analysis (scoring) of Russian BPIF investment declarations investing in shares of Russian issuers, we selected 15 exchange-traded funds (Table – 1).
Table 1. BPIF samples, grouped by quartiles (based on the annual return of funds)
|
№
|
BPIF
|
ISIN/ Registration number
|
Return
(monthly)
|
Return (annual)
|
Quartile
|
|
1
|
Alpha_tech
|
RU000A0JRXG8
|
0.00296
|
0.036109
|
1 (25%)
|
|
2
|
BCS_perspective
|
RU000A0HF0L2
|
-0.0135
|
-0.15052
|
1 (25%)
|
|
3
|
First_ESG
|
RU000A1024P8
|
0.000466
|
0.005607
|
1 (25%)
|
|
4
|
VTB_RSI
|
RU000A103LL2
|
-0.0028
|
-0.03307
|
1 (25%)
|
|
5
|
BCS_22century
|
RU000A0JP708
|
0.006054
|
0.075119
|
2 (50%)
|
|
6
|
Raiff_infotech
|
0988-94131961
|
0.003251
|
0.039715
|
2 (50%)
|
|
7
|
RScHB_future
|
RU000A0JS9S1
|
0.004626
|
0.056945
|
2 (50%)
|
|
8
|
RSchB_RSPP
|
RU000A101R66
|
0.003242
|
0.039611
|
2 (50%)
|
|
9
|
April_nonprimary
|
RU000A0HP298
|
0.016427
|
0.21594
|
3 (70%)
|
|
10
|
MKB_tech
|
RU000A0JWHX6
|
0.011978
|
0.153587
|
3 (70%)
|
|
11
|
VTB_powerenergy
|
RU000A0JKL78
|
0.017919
|
0.237532
|
3 (70%)
|
|
12
|
BCS_energy
|
RU000A0HF0L2
|
0.01985
|
0.266004
|
4 (100%)
|
|
13
|
First_biotech
|
RU000A0JVLK7
|
0.018609
|
0.247643
|
4 (100%)
|
|
14
|
Raiff_power
|
0987-94132127
|
0.020265
|
0.272204
|
4 (100%)
|
|
15
|
System_biotech
|
RU000A104FE7
|
0.037235
|
0.550691
|
4 (100%)
|
We also note that in order to be able to include BPIF in our sample, the following conditions were additionally imposed, which will allow us to obtain statistically significant, comparable results:
1. The sample includes only Russian funds investing in Russian securities, the investment currency is the Russian ruble;
2. Only funds are taken into account, on the results of which statistical information is available throughout the entire assessment period;
3. For the entire period of the study, the funds are formed.
According to the trust management rules of the funds selected for the study, the funds of these funds are invested in securities of the technology sector, the medical industry, biotechnology, information technology, the Internet and telecommunications technologies – i.e., in industries that meet ESG and social responsible investment (SRI) criteria. In addition, as can be seen from Table – 1, a number of funds (First ESG, VTB RSI) invest in securities directly related to the ESG sector.
In addition, we note that in the framework of this paper, the benchmark for selected BPIFs is the Moscow Exchange Index - RSPP Vector of Sustainable Development - one of the first MOEX indexes, declared as an ESG index, moreover, the replication of this index is an investment goal of a number of funds selected by us, which directly spelled out in the rules of trust management of portfolios of these funds.
The study is carried out on the time interval from 01.15.2021 to 02.24.2022. The choice of the length of the time series is mainly due to the fact that only starting from 2021, a fairly complete database of companies for calculating ESG ratings began to form in Russia (in 2019 RAEX-Europe disclosed ESG ratings only for 14 Russian issuers in 2020 – for 51, and in 2021 and the first 4 months of 2022 – for 148 and 160 issuers of Russian securities, respectively).
To evaluate the cross-sectoral panel regression according to the Fama-French model, the values of the SMB, HML, RMW and CMA factors are downloaded from the official website of the developers of this model (according to the instructions given on the website, we use data for emerging markets) [8]. To calculate a variable that allows us to take into account the influence of ESG factors (in our case, the LML variable), we divide the funds of our sample into 4 quartiles (we build these quartiles based on the average annual BPIF return for the study period), then we find the monthly returns of the funds (for 22 trading days) and calculate the LML factor as the difference between the returns of the funds that showed the highest and lowest management results (average monthly return on shares).
To obtain statistically significant regression estimates in modeling, we use daily data on the value of shares of funds included in the sample, for which we then calculate the monthly values of the return of the funds selected for the benchmark study (MRSVT index), the risk-free rate of return (in our calculation, we consider the risk-free rate values of the zero-coupon yield curve of government bonds with a maturity of 1 year [10].
Describing the selection of funds, we consider it necessary to note the following.
The distribution of monthly returns of funds in the time interval we considered had a character different from normal (Figure – 1), as indicated by the pronounced presence of the right tail of the distribution, as well as the value of the asymmetry coefficient (skewness - 4.031), kurtosis (21.227), the value of Jarque-Bera statistics (106076.6). Moreover, as the Probability value is 0.000, the hypothesis H0 (the distribution does not differ from normal) is at the significance level α, equal to 0.05, we reject.
We believe that this kind of distribution of returns of the funds included in our sample may take place due to the inclusion in the sample of funds that differ significantly in NAV (we did not take this parameter into account when selecting funds, because for the purposes of our study it does not have a substantive role).
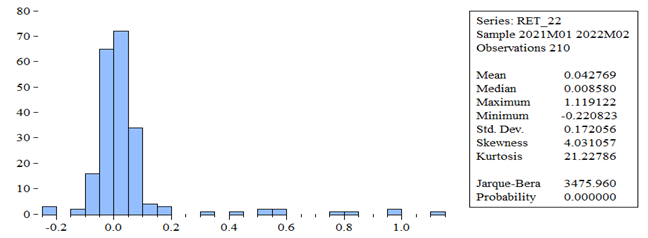
Figure 1. Distribution of monthly BPIF returns of the sample and descriptive statistics of fund returns for the period 01.15.2021-02.24.2022
Source: Compiled by the author based on a calculation in EViews 10.
Nevertheless, we take into account the above factors and assume that our results will have a certain bias. However, given the income distribution statistics and the selection criteria for our calculation, we believe that the bias won’t be critical.
At the same time, we note a fairly high level of correlation between the returns of BPIF units and the MRSVT benchmark (Figure – 2).
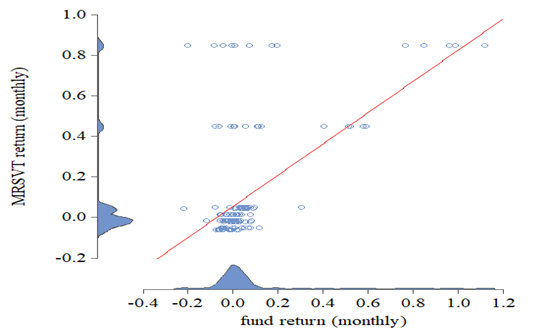
Figure 2. Correlation of sample BPIF returns and MRSVT returns (monthly data)
Source: Compiled by the author based on the calculation in EViews 10.
The correlation has a pronounced positive character, there is a small number of outliers. Taking into account the nature of the distribution of outliers, we believe that they will not be able to have a strong influence on the estimates of the regression parameters.
Nevertheless, for a more detailed analysis of the quality of benchmark selection for funds, let's build a Scatter with the regression line chart for funds of each of the four quartiles Q1-Q4 (Figure – 3).
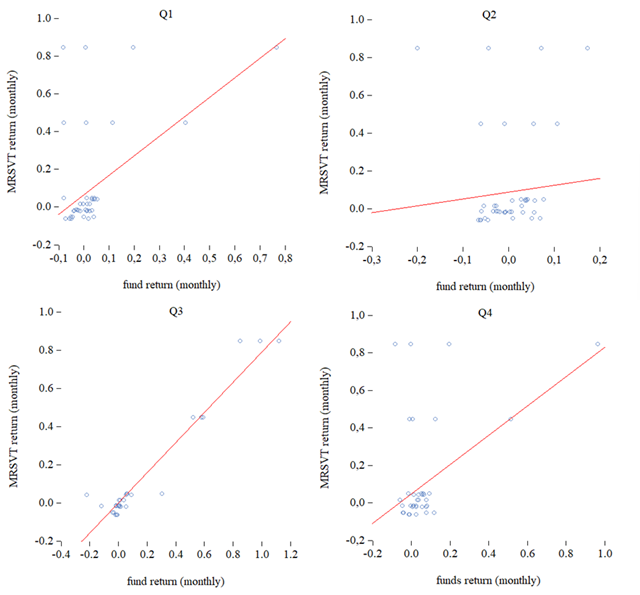
Figure 3. Correlation of Q1-Q4 Quartile BPIF returns and MRSVT returns (monthly data)
Source: Compiled by the author based on the calculation in EViews 10.
The data presented in Figures 2 and 3, Table – 1, allow us to conclude that, in general, the nature of the distribution of returns on fund units by quartiles Q1-Q4 (adjusted for the average and median values of the returns of funds of different quartiles) is quite similar (exception is Q2, in which outliers are more significant than in other quartiles, however, their number is not critical). Thus, we believe that the conclusions that we will get by evaluating the returns on the shares of all OPIFs in the sample will also be valid for the funds of the Q1-Q4 quartiles.
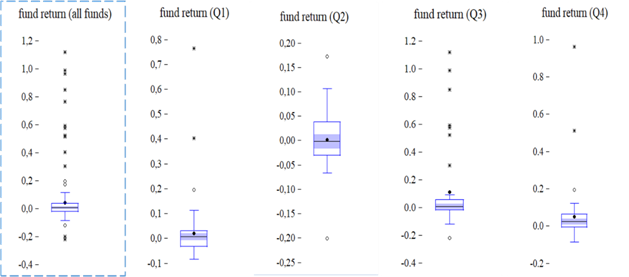
Figure 4. Box plot of distribution of BPIF returns by quartiles (Q1-Q4)
Source: Compiled by the author based on the calculation in EViews 10.
Table 2. BPIF descriptive statistics by quartiles (Q1-Q4)
|
all funds
|
Q1
|
Q2
|
Q3
|
Q4
| |
|
Mean
|
0.042769
|
0.022165
|
0.002563
|
0.111756
|
0.05184
|
|
Median
|
0.00858
|
0.007586
|
-0.00138
|
0.008617
|
0.025855
|
|
Maximum
|
1.119122
|
0.766207
|
0.173205
|
1.119122
|
0.963571
|
|
Minimum
|
-0.22082
|
-0.08207
|
-0.20035
|
-0.22082
|
-0.08343
|
|
Std. Dev.
|
0.172056
|
0.124026
|
0.055475
|
0.298064
|
0.148352
|
|
Skewness
|
4.031057
|
4.479029
|
-0.25252
|
2.092172
|
4.773105
|
|
Kurtosis
|
21.22786
|
25.76099
|
5.748964
|
6.577272
|
28.20239
|
|
Jarque-Bera
|
3475.96
|
1396.055
|
18.2277
|
53.03482
|
1694.678
|
|
Probability
|
0
|
0
|
0.00011
|
0
|
0
|
|
Sum
|
8.981589
|
1.241243
|
0.143523
|
4.693762
|
2.903061
|
|
Sum Sq. Dev.
|
6.187086
|
0.846041
|
0.169262
|
3.642531
|
1.210457
|
|
Observations
|
210
|
56
|
56
|
42
|
56
|
Source: Compiled by the author based on the calculation in EViews 10.
Taking into account the assumptions and limitations that we introduced into the process of selecting data for evaluation, when evaluating the performance of multivariate regressions taking into account the LML factor (CAPM, 5-factor Fama-French model), it is necessary to analyse the adequacy of the parameters of these regressions.
Capital asset pricing Model (CAPM) with LML-factor.
1. Checking the random nature of the regression residuals. The residuals of the regression are random in nature (the check was carried out on the basis of the analysis of the Residual Table in EViews 10), Figure – 5.
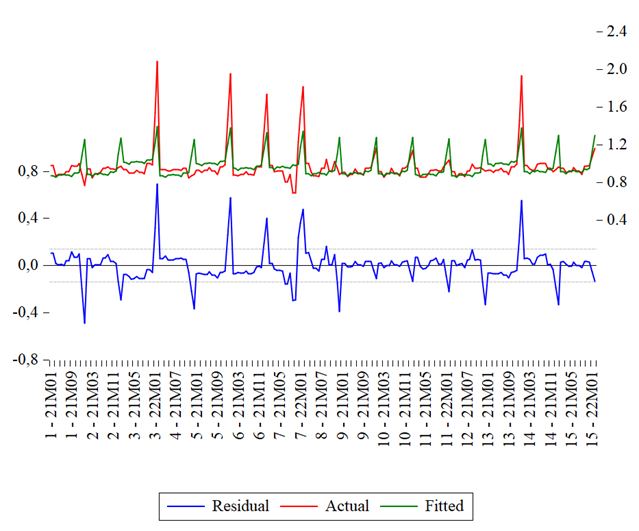
Figure 5. Residuals graph for CAPM with LML-factor
Source: Compiled by the author based on the calculation in EViews 10.
2. Checking if the mathematical expectation is equal to zero. The value of the mathematical expectation (Mean) is -1.32e-18, i.e., close enough to zero (Figure 6). Thus, the 3-rd premise of the LSM about a constant value of the variance is satisfied.
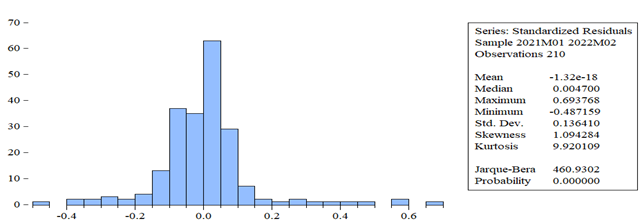
Figure 6. Standardized Residuals statistics for CAPM with LML-factor
Source: Compiled by the author based on the calculation in EViews 10.
3. It is not possible to test the heteroscedasticity of regression residuals due to the fact that the assessment is based on panel data.
4. Check for autocorrelation of regression residuals. Testing the Durbin-Watson statistics made it possible to conclude that there is a slight positive correlation of the regression residuals (dL = 1.48; dU = 1.50; DWfact = 0.52).
5. Checking the nature of the distribution of regression residuals (H0: distribution does not differ from normal). The Jarque-Bera statistics shown in Figure N and the probability value of the Jarque-Bera criterion allow us to reject the hypothesis H0. The asymmetry coefficient is 1.09; kurtosis – 9.92. Thus, the distribution of regression residuals obeys a law different from normal.
Conclusion on testing the residuals of the CAPM with LML-factor regression: The obtained regression estimates have a certain bias, the effectiveness and consistency of the estimates have not been fully confirmed, the use of regression is possible.
Fama-French 5-factor model with LML-factor.
1. Checking the random nature of the regression residuals. The residuals of the regression are random in nature (the check was carried out on the basis of the analysis of the Residual Table in EViews 10), Figure – 7.
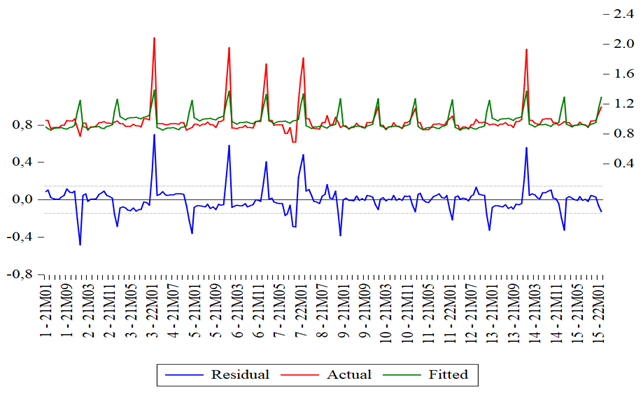
Figure 7. Residuals graph for Fama-French 5-factor model with LML-factor
Source: Compiled by the author based on the calculation in EViews 10.
1. Checking if the mathematical expectation is equal to zero. The value of the mathematical expectation (Mean) is 3.17e-18, i.e., close enough to zero (Figure – 8). Thus, the 3rd premise of the LSM about a constant value of the variance is satisfied.
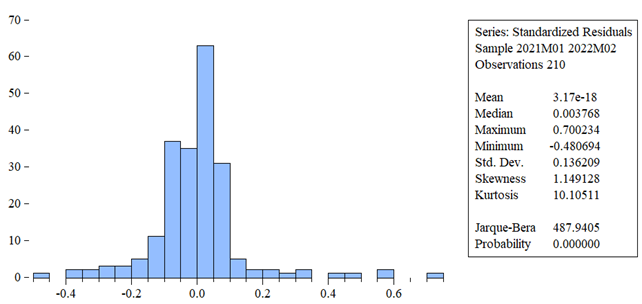
Figure 8. Standardized Residuals statistics for CAPM with LML-factor
Source: Compiled by the author based on the calculation in EViews 10.
2. It is not possible to test the heteroscedasticity of regression residuals due to the fact that the assessment is based on panel data.
3. Check for autocorrelation of regression residuals. Testing the Durbin-Watson statistics made it possible to conclude that there is a slight positive correlation of the regression residuals (dL = 1.48; dU = 1.50; DWfact = 0.517).
4. Checking the nature of the distribution of regression residuals (H0: distribution does not differ from normal). The Jarque-Bera statistics shown in Figure N and the probability value of the Jarque-Bera criterion allow us to reject the hypothesis H0. The asymmetry coefficient is 1.15; kurtosis – 10.11. Thus, the distribution of regression residuals obeys a law different from normal.
Conclusion on testing the residuals of the Fama-French 5-factor model with LML-factor regression: the obtained regression estimates have a certain bias, the effectiveness and consistency of the estimates have not been fully confirmed, the use of regression is possible.
Thus, based on the data presented above, we believe that the use of CAPM and Fama-French 5-factor model, taking into account the LML-factor calculated by us, is possible.
Table – 3. demonstrates the results of the analysis of regression parameters (based on CAPM and Fama-French 5-factor model, later LML-factor was added to each of the regressions).
Table 3. Estimation of the parameters of the CAPM, FF5 regressions and these models,
taking into account the ESG factor (LML-factor)
|
Variable |
Model
|
CAPM
|
CAPM with LML-factor
|
FF5
|
FF5 with LML-factor
|
|
C(1)
|
0.544104
|
0.544667
|
0.537726
|
0.537978
|
|
Std. Error c1
|
0.039719
|
0.039963
|
0.047325
|
0.047525
|
|
t-Statistic c1
|
13.69879
|
13.62922
|
11.36242
|
11.3198
|
|
Prob c1
|
0
|
0
|
0
|
0
|
|
C(2)
|
0.417737
|
0.416599
|
0.420083
|
0.420362
|
|
Std. Error c2
|
0.038069
|
0.038775
|
0.044509
|
0.044726
|
|
t-Statistic c2
|
10.9732
|
10.74405
|
9.438096
|
9.3987
|
|
Prob c2
|
0
|
0
|
0
|
0
|
|
C(3)
|
0.001458
|
0.004315
|
0.004434
| |
|
Std. Error c3
|
0.008784
|
0.007088
|
0.00722
| |
|
t-Statistic c3
|
0.166011
|
0.608788
|
0.614175
| |
|
Prob c3
|
0.8683
|
0.5434
|
0.0398
| |
|
C(4)
|
0.000753
|
0.000509
| ||
|
Std. Error c4
|
0.006945
|
0.007435
| ||
|
t-Statistic c4
|
0.108349
|
0.068454
| ||
|
Prob c4
|
0.0138
|
0.9455
| ||
|
C(5)
|
0.005
|
0.005099
| ||
|
Std. Error c5
|
0.008622
|
0.008709
| ||
|
t-Statistic c5
|
0.579913
|
0.58548
| ||
|
Prob c5
|
0.5627
|
0.0589
| ||
|
C(6)
|
-0.007341
|
-0.007583
| ||
|
Std. Error c6
|
0.011355
|
0.011675
| ||
|
t-Statistic c6
|
-0.64649
|
-0.649504
| ||
|
Prob c6
|
0.0187
|
0.5168
| ||
|
C(7)
|
-0.000971
| |||
|
Std. Error c7
|
0.010385
| |||
|
t-Statistic c7
|
-0.093545
| |||
|
Prob c7
|
0.0256
| |||
|
R-squared
|
0.426536
|
0.426617
|
0.428279
|
0.428306
|
|
Adjusted
R-squared
|
0.382195
|
0.379083
|
0.371107
|
0.367809
|
|
S.E. of
regression
|
0.141596
|
0.141952
|
0.142861
|
0.143235
|
|
Sum squared
resid
|
3.889584
|
3.889028
|
3.877757
|
3.877578
|
|
Log likelihood
|
120.8475
|
120.8625
|
121.1672
|
121.1721
|
|
F-statistic
|
9.619647
|
8.974936
|
7.491054
|
7.079812
|
|
Prob(F-statistic)
|
0
|
0
|
0
|
0
|
Source: Compiled by the author based on the calculation in EViews 10.
Based on the data given in Table – 3, it can be stated that all the models we have considered (both without the LML factor and with the LML factor taken into account) have sufficient predictive abilities. (Adjusted R-squared is at least 35% - Figure – 9). However, adding the LML factor degrades the quality of the underlying regressions.
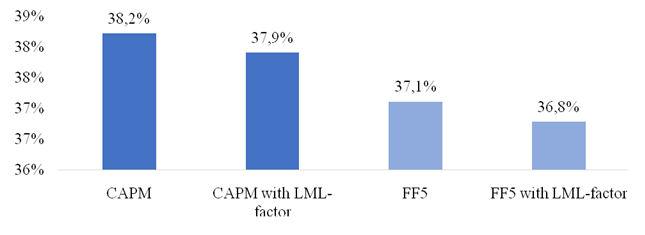
Figure 9. Quality of regressions (adj. R^2) CAPM, CAPM with LML-factor,
FF5 and FF5 with LML-factor
Source: Compiled by the author based on the calculation in EViews 10.
At the same time, it should be noted that the CAPM and Fama-French 5-factor models gave different estimates for the LML parameter. In particular, in CAPM with LML-factor variable c (3) is not statistically significant, in Fama-French 5-factor model variable c (7) is a significant variable.
We note that the influence of the LML-factor in the Fama-French 5-factor model with LML-factor on the BPIF return of the sample is negative, however, this influence is extremely insignificant - the value of the variable is -0.000971). Estimates of this factor are expectedly grouped around 0 (Figure – 10).
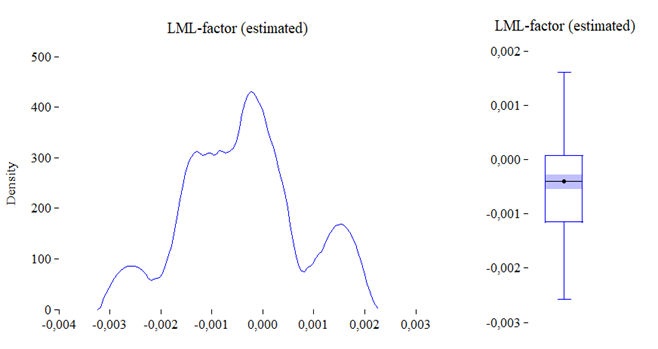
Figure 10. ESG (LML)-factor estimated with Fama-French 5-factor model with LML-factor values (Kernel density, boxplot)
Source: Compiled by the author based on the calculation in EViews 10.
Conclusions
The importance of educational work cannot be overstated. Respondents think that raising awareness of ESG concerns has the ability to affect people's perceptions of ESG investment and have an impact on the market, as long as these issues are brought up and addressed with various stakeholders on a regular basis [4]. It is necessary to guarantee that these issues are covered by the media. Furthermore, ESG concerns should be discussed at conferences and other events, and information about them should be communicated to a larger audience, not only among investing experts, in order to enhance general understanding [5].
5-factor model, taking into account the LML-factor, quite well explains the generation of BPIF returns by quartiles, while the LML factor turned out to be significant only for funds Q2 and Q4.
According to the data we presented the funds of these quartiles have a lower correlation with the MRSVT benchmark. In addition, according to the rules for trust management of funds included in the Q2 and Q4 quartiles, we could not conclude with 100% certainty that the funds are oriented to SRI. Those our initial assumption about the insignificance of the c (7) variable (i.e. ESG-factor) for the Q2 and Q4 quartile funds was not confirmed.
The influence of the significant parameter c (7) on the generation of returns of the funds of quartiles Q2 and Q4 is different: the estimates of this parameter have opposite signs. Nevertheless, the influence of the LML-factor for both Q2 and Q4 is minimal.
Источники:
2. Митяков С. Н. Новые цели устойчивого развития России // Развитие и безопасность. – 2023. – № 1(17). – c. 21-35. – doi: 10.46960/2713-2633_2023_1_21.
3. Паршаков П. А. Оценка эффективности деятельности по управлению активами российских паевых инвестиционных фондов. / дис.,.. канд. экон. наук. - Москва, 2014.
4. Самидов А. М., Болонин А. И. Перспективы развития «зеленого финансирования» в системе государственного регулирования устойчивого развития // Экономика устойчивого развития. – 2022. – № 3. – c. 84-89.
5. Bolonin A. I. Financial Innovations, Financial Engineering and Financial Technologies: Risks or New Opportunities? Innovations and New Financial Technologies in the Practice of Banking. / A. I. Bolonin, I. B. Turuev, V. Balykin // Financial Markets Evolution: From the Classical Model to the Ecosystem. Challengers, Risks and New Features. - London: Palgrave Macmillan, 2021. – 129-141 p.
6. Fama E., French K. A five-factor asset pricing model // The Journal of Financial Economics. – 2014. – № 116(1). – p. 1-22.
7. Jensen M. Risk, the Pricing of Capital Assets, and the Evaluation of Investment Performance // Journal of Business. – 1969. – № 42. – p. 167-247.
8. Kenneth R. French Official Website. [Электронный ресурс]. URL: http://mba.tuck.dartmouth.edu/pages/faculty/ken.french/index.html (дата обращения: 30.04.2023).
9. Kuksov A.S. Socially Responsible Investment in the Russian Stock Market // Review of Business and Economics Studies. – 2022. – № 10 (4). – p. 55-66. – doi: 10.26794/2308-944X-2022-10-4-55-66.
10. Кривая бескупонной доходности государственных облигаций. Банк России. [Электронный ресурс]. URL: https://www.cbr.ru/hd_base/zcyc_params/zcyc/ (дата обращения: 30.04.2023).
11. Yuval Noah Harari 21 Lessons for the 21st Century. - Sindbad Publishers Ltd., 2018.
Страница обновлена: 19.07.2026 в 18:44:38
Download PDF | Downloads: 45 | Citations: 1
Factors facilitating and hindering the development of ESG investments in Russia
Aleksey I.B., Kuksov A.S.Journal paper
Economic security
Volume 6, Number 2 (April-June 2023)
Abstract:
Today's discussion about sustainable development has its roots in the 1970-s and evolving along with growing social and environmental crises. For a long time, to integrate non-financial issues into asset management processes, the financial market has experimented with various approaches, using names such as «ethical», «socially responsible» or «sustainable investment». Climate change, as one of the three global problems of mankind creates significant financial problems for the world community.
Investors are currently trying to take environmental, social and governance (ESG) into account when making investment decisions. At the same time, market participants are still little aware of the nuances of the ESG integration process, which is sometimes associated with the approach to the withdrawal of individual industries, firms and projects from the portfolio. Investors believe that corporate governance issues are critical as they directly affect profitability and, ultimately, a firm's dividend policy. However, few people are aware of the impact of environmental and social factors on the company's financial performance.
Keywords: ESG investments, green investments, responsible investments, approaches to identifying investment risks
JEL-classification: Q01, Q50, Q56
References:
Bolonin A. I. (2021). Financial Innovations, Financial Engineering and Financial Technologies: Risks or New Opportunities? Innovations and New Financial Technologies in the Practice of Banking
Bolonin A. I., Ragulina Yu. V. (2019). Innovatsii v razvitii ekonomiki i obshchestva [Innovations in economic and social development] (in Russian).
Fama E., French K. (2014). A five-factor asset pricing model The Journal of Financial Economics. (116(1)). 1-22.
Jensen M. (1969). Risk, the Pricing of Capital Assets, and the Evaluation of Investment Performance Journal of Business. (42). 167-247.
Kenneth R. French Official Website. Retrieved April 30, 2023, from http://mba.tuck.dartmouth.edu/pages/faculty/ken.french/index.html
Kuksov A.S. (2022). Socially Responsible Investment in the Russian Stock Market Review of Business and Economics Studies. (10 (4)). 55-66. doi: 10.26794/2308-944X-2022-10-4-55-66.
Mityakov S. N. (2023). Novye tseli ustoychivogo razvitiya Rossii [Russia's New Sustainable Development Goals]. Razvitie i bezopasnost. (1(17)). 21-35. (in Russian). doi: 10.46960/2713-2633_2023_1_21.
Parshakov P. A. (2014). Otsenka effektivnosti deyatelnosti po upravleniyu aktivami rossiyskikh paevyh investitsionnyh fondov [Assessing the effectiveness of asset management activities of Russian mutual funds] (in Russian).
Samidov A. M., Bolonin A. I. (2022). Perspektivy razvitiya «zelenogo finansirovaniya» v sisteme gosudarstvennogo regulirovaniya ustoychivogo razvitiya [Prospects for the development of green financing in the system of state regulation of sustainable development]. Sustainable Development Economics. (3). 84-89. (in Russian).
Yuval Noah Harari (2018). 21 Lessons for the 21st Century