The Iranian strategy to diversify sources of income to get out of the characteristics of the rentier economy
Nour Abdul Sattar Ibrahim1
1 Wasit University, College of Administration and Economics, Ирак, Эль-Кут
Скачать PDF | Загрузок: 37
Статья в журнале
Экономические отношения (РИНЦ, ВАК)
опубликовать статью | оформить подписку
Том 11, Номер 1 (Январь-март 2021)
Эта статья проиндексирована РИНЦ, см. https://elibrary.ru/item.asp?id=45625180
Аннотация:
The author of the article explains the reality of the Iranian economy and clarifies the most important plans and mechanisms necessary for the success of the economic diversification policy in Iran to raise the level of economic growth in it and get rid of the rentier character.
Ключевые слова: rural economy, economic diversification, GDP, strategic planning
JEL-классификация: O11, O40, O53
Introduction
Iran is the fifth largest exporter of the oil sector and ranks second in the world in terms of gas reserves, which contributes a significant percentage to government revenues and forms the main pillar of the country's exports, but without a doubt, there is strong potential for the growth of some other economic sectors such as petrochemicals, iron, and steel, spinning, weaving, and manufacturing. Cars as well as the services side, made it deal better with the changes taking place in the global oil markets. To know the steps that it has taken to diversify its economy, it is necessary to review the reality of this economy and its steps to achieve the desired benefit to achieve the objectives of the research.
Research problem
The economic sanctions and wars that the Iranian economy has been subjected to have made it isolated from the international arena, which led to its dependence on self-sufficiency and a decline in foreign trade, except for oil and gas exports. Therefore, studying the reality of the Iranian economy and the strategy followed makes it possible to understand the development and growth in the gross domestic product.
Research Goal
The research aims to evaluate the necessary policies and measures to diversify the Iranian economy, to identify the positive developments resulting from them.
Research hypothesis
The research starts from the premise that diversifying the economic base is the best solution to get out of the rentier dependency, provided that the rentier resource is used to raise the productivity of other sectors and raise the percentage of their contribution to the formation of the gross domestic product to maintain a balanced economic growth.
(1) The reality of the Iranian economy (summary)
Iran occupies an important place on the global political and economic map and is one of the countries rich in oil, gas, and natural resources. It is currently receiving international attention due to its strategic location and the attractive investments it can contain for world countries, Iran is located in western Asia, and the name Iran in Persian means the land of the Aryans [16, р. 70] (Kamiar Mohaddesa, M. Hashem Pesaran, 2012, р. 70), and this name has been used since the time of the Sassanid’s in ancient times 3.77 million people are now, and it is the second-largest country in the region after Egypt in terms of population.
It is a distinct country because of the importance of its geopolitical location, as it is the meeting point of three Asian areas (West, Central, and South Asia), bordered on the north by Armenia, Azerbaijan, and Turkmenistan, and Iran overlooks the Caspian Sea, an inland sea bordered by Kazakhstan and Russia, and bordered on the east by Afghanistan and Pakistan, and on the south by the Persian Gulf. And the Gulf of Oman, and from the west, Iraq, and the northwest, Turkey, Tehran is the capital, the largest city in the country, and the political, cultural, commercial, and industrial center. Iran occupies an important position in international energy security and the global economy due to its large reserves of oil and natural gas. As mentioned, the political system in Iran Based on the 1979 constitution that includes many intricately interconnected bodies, the highest authority in the state is the Supreme Leader, the local currency is the riyal, and the official language of Iran is Persian, The Iranian economy depends on many sectors, especially the oil sector, as three periods are describing the development of this sector and thus the development of the economy in general. During the period from 1908 to 1959, oil production had an important role in the Iranian economy, as the first discovery of a field for oil production. However, Iran's share of exports was not large due to the control of giant international companies on production and marketing. Then the oil sector was nationalized and what is known as Iran's oil network was established.
The period from 1960 to 1978 witnessed major changes in the international oil industry and the expansion of oil revenues for Iran, as oil prices rose and consequently, Iranian oil revenues from its exports rose due to increased production as well as the best rent terms set by OPEC in renegotiating contracts between producers and host companies And represented by the low levels of rent that the Iranian government received from foreign oil companies operating in Iran But the main factor behind the huge increase in oil revenues in Iran in 1970 is the rise in prices, which were modest in the beginning, but then they became large after the doubling of world oil prices in 1973–1974, As for the third period, which was the year 1979, the Iranian revolution took place and its great repercussions not only on the region but also on the whole world [4, p. 16] (Ahmed Shamseddine Laila, р. 16). As this period witnessed major changes in the international oil industry and oil exports decreased from 6 million barrels to 4 million barrels per day, in addition to the fluctuation in Iranian oil revenues due to the eight-year war with Iraq for the period from 1980–1988. The ratio of the contribution of oil exports to GDP is somewhat low and fluctuated around 12% between 1979 and 1988 before starting to rise slowly with the end of the Iran–Iraq war. This also reflected on the decline in per capita output during that period, as well as the US economic sanctions, which were aimed at targeting the Iranian oil and gas industry [10, p. 11–20], as well as the fluctuations in the international oil markets Then, in 1989 the post-war reconstruction phase and a series of economic and institutional reforms began, and after a few years of market-oriented reforms, the government began to liberalize the foreign exchange rate and open the capital account in 1993, but the process was not well managed and the country quickly accumulated a large short-term external debt stock, observed through the main balance-of-payments crisis of 1993–1994, when Iran experienced a current account deficit of 4.2 billion during this period. The dollar of this debt affected the reform program and also had implications for both credit and foreign exchange markets [14, p. 68].
During the mid-1990s, the Iranian economy was, always distorted by its unbalanced foreign trade and high dependence on oil as a major export commodity, which made the economy suffer a lot from periods of adverse oil shocks such as that occurred in 1998 when the current account deficit -2.14 was the largest deficit the Iranian economy has ever experienced [18, р. 56] (Mohammad Aqai, 2002, р. 56). In the balance of payments and consequently the main concern and difficult challenge of the various Iranian governments was how to diversify the economy away from oil, a bet that sought Iran has adopted the 'Vision 2025' document prepared by the Expediency Council in 2005. This document contains long-term plans for the economic, social, scientific, and technological sectors and considers that the central variable for achieving regional status is the rate of economic growth that must be around 8% in 2025 [17, p. 73] (Louis Hobeika, 2016, р. 73).
(2) Development plans and their role in diversifying the Iranian economy
The Islamic Republic of Iran has set several plans for economic development as an attempt to stop the repercussions imposed on the Iranian economy and its dependence on oil that is exposed to continuous external shocks. To clarify this, we will address the plans according to the following:
The First Development Plan (1989–1994). This plan sought to encourage non-oil exports by investing in industries that have great export potential. These non-oil exports are represented by agricultural goods, handcrafted goods, and industrial goods, as well as working to achieve self-sufficiency for the industrial sector of its primary and intermediate materials and to provide production inputs to the rest of the other sectors. To achieve this, the plan allowed for the benefit of foreign technical expertise and the influx of modern technology So it worked to encourage partnership with foreigners to attract foreign capital as well as to encourage the country's residents residing abroad to invest their money in their country of origin. In the fields of food industries, textiles, building materials, and chemical industries, this plan helped reduce the demand for raw materials needed by the industrial sector As its inputs became locally produced with the export of the surplus, and non-oil exports increased from 31,096 billion riyals in 1989 to an amount of 145,860 billion riyals in 1993 [20, p. 37] (Nabil Jaafar Abdul Ridha, 2000, р. 37).
Focusing in this plan on the industrial sector is one of the priorities of the economic reform that Iran sought, as it is considered one of the main sectors in the economy through the percentage of its contribution to the GDP, after the industrial sector used to constitute 16.8% in the output as an average of the period 1980–1985 which is a low percentage due to the Iran-Iraq war, and most factories stopped working due to that war and then the decrease in production capacities but after the reform and the development of the five-year development plan for the aforementioned period, the percentage of its contribution to the product was raised to 37.6% for the year 1995 [11, p. 44] (Hadi Salehi Esfahanim, Kamiar Mohaddes, 2009, р. 44).
The Second Development Plan for 1995–1999. The state has played an important and vital role in the Iranian economy since 1979 as a result of the state's possession of large oil resources, which led to large financial revenues and was largely reflected in the volume of government spending and was the main driver of the activity of the Iranian economy, as well as the weakness of the private sector and the need to ensure a fair distribution of national income is other factors that have strengthened the role of the state in the Iranian economy, and state control made it allocate resources between consumption and investment and thus directly affect the distribution of income. The overall demand model thus became under the influence and leadership of the State [12, p. 62–63] (Hossein Ali Hashim, 2012, p. 62–63), as well as state-owned projects requiring large investments that the private sector could not manage as well as natural monopolies.
Therefore, interest in the private sector has a big role in the development of the public sector, there can be no prosperity in the part of the economy with the rest remaining backward, there must be reforms at the macro level and development in the regulatory framework and raise the degree of competitiveness by carrying out a large wave of investments in all sectors at once so that the market expands and thus increases the demand for products to prevent development bottlenecks that hinder development, there must be balanced growth in all sectors. The second development plan, therefore, emphasized the role that both the state and the private sector can play in expanding the non-oil export base and called for taking advantage of Iran's comparative advantages in this area [6, p. 18].
Mohammad Khatami put out the plan of the so-called "break the monopoly", ending the dominance of public companies in the Iranian economy, privatization of important sectors in Iranian institutions such as railways, mail, and telephone, encouraging individual initiatives, private investment and monitoring oil revenues to meet the need for industrial development and productivity [11, p. 101] (Hadi Salehi Esfahanim, Kamiar Mohaddes, 2009, р. 101), and coincided with the sharp decline in oil prices in international markets, the inability of the government to pay some of its external debt, as well as the severe drought in the agricultural sector, which made it consider a greater role for the private sector. To create a more sustainable growth rate, the second plan aimed to achieve real growth of 5% in the country's GDP, but in practice, it was 2.8% [7, p. 87].
All these obstacles have forced the government to engage in a series of policies to diversify the non-oil export base by [3, p. 116] (Ahmed Jassim Mohammed, 2006, р. 116):
a) Providing a promising environment for the private sector in which it can operate efficiently by allowing private enterprises to play a major role in the development of productive sectors while providing all possible assistance and financial incentives by the State.
b) Encourage barter trade for non-oil exports with other countries in line with the tastes of consumers in importing countries.
c) Strengthening the role of the Export Development Bank as well as expanding the activities of the Export Guarantee Fund.
d) Facilitating access to loans from banks to finance small and medium-sized enterprises, as well as opening up foreign contributions by establishing a partnership between the regional company and private sector companies in the country.
e) Allocating part of the domestic production for export and using existing production capacities to expand the export base by adopting a tariff policy as a pro-export market.
The Third Development Plan (2000–2004). Iran began with the Third Development Plan to pay serious attention to the problem of growth and development, despite regional tensions and international pressures, the Iranian economy performed relatively well during this period as the real growth rate in output 5.5 %. This is slightly below the planned rate of 6.0%. This is due to government policy decisions that have led to the large-scale removal of restrictions to enhance private sector contribution, on the one hand, and increase crude oil prices on international markets, as well as to liberalize foreign trade procedures by liberalizing tariffs on trade and giving exporters more flexibility in maintaining their export earnings [4, p. 112] (Ahmed Shamseddine Laila, р. 112).
The share of trade in output increased from 45.2% in 2000 to the equivalent of 97.5% In 2004, exports increased from 163,109,991 billion riyals to 382,443,039 for the same period due to the government's policy of encouraging and protecting the domestic product [18, p. 40–46] (Mohammad Aqai, 2002, р. 40–46), by imposing a high market tariff on imported goods that have the same comparative advantage as goods at home as well as providing facilities for imported inputs needed by domestic production, as well as establishing protection laws for the consumer product.
The plan also included several important reforms aimed at reducing the budgetary dependence on oil revenues and reducing increased spending that increases inflation, including tax reform, which began in 2000 because taxes and revenues from them did not receive the attention of fiscal policymakers, given the availability of oil in large quantities and thus securing revenues, so the reform came to strengthen the government's non-oil revenue base, ensure transparency and simplify tax laws, i.e. be clear and opaque. For those charged, corporate profits taxes have also been reduced from 40% to 25% reducing the tax rates for sales transactions from 12% to 5%. This action encouraged economic activities and increased profit margins [5, p. 125] (Akbar Kamigani, 2003, р. 125).
In addition to establishing the Oil Fund for Economic Stabilization (OSF) under the central bank's administration as a mechanism for controlling oil revenues, the aim of which was to stabilize the annual budgets and finance private sector projects mixed in hard currency through investment banks, to mitigate the impact of oil fluctuations on spending, and to measure to improve public expenditures and use them optimally and in areas that increase opportunities for economic growth, this plan aimed to standardize the exchange rate, integrate the exchange market and reduce the informal market [20, p. 21] (Nabil Jaafar Abdul Ridha, 2000, р. 21). The reason for the unification of the exchange rate what Iran was experiencing from the problem of stabilizing the value of its domestic currency (the Iranian rial) against the dollar, and the emergence of multiple exchange rates for the rial against the dollar, i.e. the problem in Iran lies in the consolidation of exchange rates, and then the Central Bank announced in 2002 the application of the single exchange rate and that the main market for foreign exchange trading is the market that is between banks This strategy has helped banks to promote their transactions more freely to make buy and sell transactions according to the nature of each transaction, circumstances and factors emerging on the ground, and the Bank acts as a watchdog that allows it to intervene to raise cases of indiscipline in the market when necessary and does not interfere directly in the market [21, p. 103] (Tamer Badawi, 2014, р. 103).
The Fourth Development Plan (2005–2009). The fourth plan was developed as an extension of the previous plans to know the reality of the Iranian economy and the extent to which it gained from previous development plans, and set some of objectives to organize The relationship between oil revenues and government spending in articles (1) and (2) provided for the maintenance of surpluses of oil revenues that exceed the planned figures, as well as the use of surplus oil revenues in advance if oil revenues fall from the planned figures as well as state investment of 51% surplus oil revenues in strategic projects [10, p. 7–8].
In the field of industry, the plan focused on increasing the contribution of heavy industries. The iron and steel industry has set a goal of achieving production of 19 million tons at the end of the 2005–2010 plan [7, p. 75].
The plan also sought to raise the value of non-oil exports, and to achieve this, the plan allocated $473 billion over five years, with the private sector accounting for 58.8 percent of these investments, and the plan privatized 65 percent of the investment. From the capital of some commercial banks, electricity distribution companies, and the transportation network the oil and gas sector has benefited from investments worth $50 billion at a rate of $10 billion annually and in five years [11, p. 2] (Hadi Salehi Esfahanim, Kamiar Mohaddes, 2009, р. 2).
The plan also sought to reduce inflation through deflationary fiscal and monetary policies (especially on the consumer side) to 7.5 percent. In October 2009 [20, p. 8] (Nabil Jaafar Abdul Ridha, 2000, р. 8), the plan's goal is to reduce inflation because it represents instability and uncertainty and thus affects investment plans that can increase growth opportunities.
The plan also sought to enhance the productivity of the banking system, the government was determined to reduce its debt to the Central Bank of Iran and other banks during the period of the plan, moreover prevented the government from borrowing from banks or the central bank to enhance the continuity of the privatization program, and in January 2010 a parliamentary report was issued in which the performance of the fourth plan was assessed as it was found that despite the success of the plan, only a large number of its objectives were implemented if only 117 of the 290 articles stipulated were implemented.
In the fourth plan, this means that the plan achieved a success rate of less than 50%. The most important of these goals, which it sought to achieve, was the implementation of the government's ongoing privatization program, which the government has vigorously pursued, and the plan called for a growth rate of up to 8 percent. Throughout the plan, however, according to the parliamentary report, GDP growth 6.3% [17, p. 41] (Louis Hobeika, 2016, р. 41).
The Fifth Development Plan (2010–2015). This plan was an extension of the fourth plan, especially about raising the productive capacity of the non-oil sector, as well as a comprehensive strategy to implement reforms based on market factors, give the Central Bank greater autonomy, expand the tax base and stabilize the local currency in the market, restore the management and planning organization that was responsible for formulating the country's general budget and five-year development plans, as well as stimulating the private sector, stimulating Iran’s economic presence in the world, opening the oil sector to foreign companies, technical assistance, and The plan has been approved to build 27 petrochemical projects [13, p. 9] (Hossein Shenaw a Majid, 2016, р. 9).
With total foreign investment flows $43 billion at the end of 2014, while overseas investments $4 billion and oil and gas and manufacturing were the two largest FDI recipients, the oil and gas industries received more than half of total FDI flows, followed by the metallurgical and manufacturing sectors [8, p. 25].
The plan also kept the government away from the withdrawal of oil revenue surpluses, and the plan put in place tighter mechanisms to establish the National Development Fund (NDF) next to the Oil Fund for Economic Stabilization (OSF) and stipulated that the fund should be allocated annually 20% at least from the revenues of oil and gas in hard currency to invest in strategic projects, financing projects adopted by the private sector, and despite the economic sanctions imposed that the growth rate in GDP was 5.8% for the period 2012–2013 during this plan, due to the previous procedure followed under the plan [9, p. 29].
The Sixth Development Plan (2016–2021). This plan seeks to achieve rapid and sustained growth of 8% annually and over five years, this is achieved by attracting foreign capital and transferring between 30 and 38 percent of the total. From oil and gas revenues to the sovereign wealth fund called the National Development Fund, and work to develop the oil industry, which the authorities believe needs $200 billion in investments in the coming years to reach development goals [3, p. 201] (Ahmed Jassim Mohammed, 2006, р. 201).
(3) Standards of diversification in the Iranian economy
Economic diversification is of great importance in most countries of the world, especially the rentier countries, including Iran, which depends on a single economic resource and here we will review some of the most important indicators in Iran that give a clear picture of the development and diversity of the Iranian economy as follows.
Percentage of contribution of oil and non-oil sectors to Iran's GDP
GDP is one of the most important indicators of the degree of development of the Iranian economy and to see which sectors contributed to the growth of Iranian output can be considered in the table 1 if the GDP of the State of Iran witnessed positive growth from 2000 to reach 467,930 billion riyals in 2006 and an annual growth rate of 11.1% as a result of the rise in oil prices, especially in 2005 and 2006, as well as the adoption of a development plan aimed at reducing dependence on oil and an attempt to revive the economy during this period, as mentioned earlier in the Development Plan for 2000, the contribution of non-oil output to GDP in 2006 increased to 89.4 and at a growth rate of 11.7%. Compared to the low oil output contribution of 12.4 during the period 2007–2011 economic growth experienced high rates, GDP increased from 491,099 billion riyals and an annual growth rate of 4.9%. In 2007, it reached 2.158 billion riyals in 2011 with a growth rate of 4.3 percent. In contrast to the high contribution of non-oil output to GDP for the same period until the ratio reached 83.8 in 2011, while oil output recorded a lower contribution rate of 16.1 for 2011, that the reason for the high contribution of non-oil output in that period was the result of what was mentioned in the development plans mentioned by raising the production capacity of the non-oil sector as well as stimulating the private sector and stimulating the Iranian economic presence in the world, while the plan was focused on increasing the plan. With the contribution of heavy industries, the iron and steel industry has set a goal of achieving the production of 19 million tons at the end of the 2005–2010 plan.
Then, in 2012, GDP (at constant prices) began to decline due to international sanctions and increased pressure from major powers on Iran over its nuclear program, and the gross domestic product (2,011,554) reached 1 billion riyals in 2012 at a low growth rate of 6.7 percent. Similarly, in 2013, GDP continued to decline, with a low growth rate of 1.9 percent, resulting in a collapse of the Iranian economy and a rise in unemployment, which reached 14 percent. Inflation in the country has also risen to 40 percent. In 2013, Iran was ranked among the highest in the world in the rate of price increases at the time, as well as preventing international companies from working and investing inside Iran, and the rate of decline of the Iranian economy during the period 2012–2013 was 6.8%, 1.2% [5, p. 15] (Akbar Kamigani, 2003, р. 15).
In 2012–2014, the Imposition of sanctions on Iran also affected both oil and non-oil output, which was evident in the negative growth rate during the period 2012–2013 In conjunction with the easing of sanctions on Iran because of the price of relations over the nuclear deal and talk towards freeing billions of dollars of Iranian funds held by European banks, GDP recorded positive growth rates during the years 2015–2016, if output increased from 2,031,596 to 2,140,560 billion riyals respectively, which was reflected in the rise in the contribution of non-oil output to 90.1 in 2016 against the decline in the contribution ratios of the oil output sector to 0.1 for the same year. Then the gross GDP started to rise and fall, until it reached in 2019 2,185964 billion riyals. The reason is due to the contraction of oil output and the rise in non-oil output driven by agriculture and manufacturing industries, and this was a reflection of the huge impact that the Corona pandemic has had on all parts of the world., and the rate of growth of the compound output Gross Domestic Product 10.1% during the period 2000–2019 which led the IMF to describe Iran as the largest economy of the Middle East, North Africa and Central Asia, data show that the non-oil sectors make up large proportions of the country's GDP during the period, reflecting a greater diversification in the country's output and an indicator of the strength of the Iranian economy.
Table 1
Ratio of the contribution of oil output and non-oil output to Gdp in Iran for the duration (2000–2019) in constant prices (1 billion riyals)
|
Year
|
GDP |
Percentage
change
|
Output
Oil |
Percentage
change
|
Percentage of
oil output contribution to GDP %
|
Non-output
Oil |
Percentage
change
|
Non-oil output
contribution to GDP ratio
%
|
|
2000
|
320069
|
----
|
42795
|
---
|
13.3
|
277274
|
---
|
86.6
|
|
2001
|
330565
|
3.2
|
38053
|
-11.0
|
11.5
|
292512
|
5.4
|
88.4
|
|
2002
|
355554
|
7.5
|
20410
|
-46.3
|
5.7
|
316149
|
8.0
|
88.9
|
|
2003
|
379838
|
6.8
|
44694
|
118.9
|
11.7
|
335144
|
6.0
|
88.2
|
|
2004
|
398234
|
4.8
|
45871
|
2.6
|
11.5
|
325363
|
-2.9
|
81.7
|
|
2005
|
420928
|
5.6
|
46144
|
0.5
|
10.9
|
374784
|
15.1
|
89.0
|
|
2006
|
467930
|
11.1
|
58249
|
26.2
|
12.4
|
418681
|
11.7
|
89.4
|
|
2007
|
491099
|
4.9
|
49868
|
-14.3
|
10.1
|
441231
|
5.3
|
89.8
|
|
2008
|
495266
|
0.8
|
48880
|
-1.9
|
9.8
|
446386
|
1.1
|
90.1
|
|
2009
|
1,942990
|
292.3
|
337537
|
590.5
|
17.3
|
1,605453
|
259.6
|
82.6
|
|
2010
|
2,068912
|
6.4
|
351855
|
4.2
|
17.0
|
1,717057
|
6.9
|
82.9
|
|
2011
|
2,157934
|
4.3
|
348347
|
-0.9
|
16.1
|
1,809587
|
5.3
|
83.8
|
|
2012
|
2,011554
|
-6.7
|
218203
|
-37.9
|
10.8
|
1,793351
|
-0.8
|
89.1
|
|
2013
|
1,972853
|
-1.9
|
198743
|
-8.9
|
10.0
|
1,774110
|
-1.1
|
89.9
|
|
2014
|
2,031596
|
2.9
|
208190
|
4.7
|
10.1
|
1,823406
|
2.7
|
89.7
|
|
2015
|
2,131554
|
4.9
|
210233
|
0.9
|
9.8
|
1,921321
|
5.3
|
90.1
|
|
2016
|
2,140560
|
0.4
|
210437
|
0.1
|
9.8
|
1,930123
|
0.4
|
90.1
|
|
2017
|
2,150642
|
0.5
|
210531
|
0.04
|
9.8
|
1,940111
|
0.5
|
90.2
|
|
2019
|
2,176767
|
1.2
|
211533
|
0.5
|
9.7
|
1,965234
|
1.3
|
90.3
|
|
2019
|
2,185964
|
0.4
|
201432
|
-4.7
|
9.2
|
1,984532
|
0.9
|
90.8
|
|
Compound growth
|
10.1
|
|
8.3
|
|
|
10.3
|
|
|
The contribution of oil revenues and non-oil revenues to the general budget of the State of Iran
The percentage of the contribution of oil and non-oil revenues from the total revenues of the general budget is one of the criteria by which the degree of economic diversification of a country can be inferred, the higher the oil revenues of the total public revenues, the lower the economic diversification, and the contrary is evidence of the high degree of economic diversification.
Table 2
Percentage of the contribution of oil revenues and non-oil revenues to the general budget of the State of Iran for the period of (2000–2019) in constant prices (billion riyals)
|
Year
|
Public revenues
|
Percentage
change
|
Oil revenues
|
Percentage
change
|
Percentage of
oil revenues to general revenues %
|
Non-oil
revenues
|
Percentage
change%
|
The ratio of
non-oil revenues to general revenues %
|
Percentage of
the general revenue of output %
|
|
2000
|
92315.7
|
ــــ
|
44170.4
|
ــــ
|
47.8
|
48145.3
|
ــــ
|
52.1
|
28.8
|
|
2001
|
104640.8
|
13.3
|
59448.5
|
34.5
|
56.8
|
45192.3
|
-6.1
|
43.1
|
31.6
|
|
2002
|
125479.5
|
19.9
|
71957.1
|
21.0
|
57.3
|
53522.4
|
18.4
|
42.6
|
35.2
|
|
2003
|
165156.7
|
31.6
|
102626.4
|
42.6
|
62.1
|
62530.3
|
16.8
|
37.8
|
34.4
|
|
2004
|
207867.5
|
25.8
|
128153.9
|
24.8
|
61.6
|
79713.6
|
27.4
|
38.3
|
52.1
|
|
2005
|
255000.3
|
22.6
|
150413.3
|
17.3
|
58.9
|
104587.0
|
31.2
|
41.0
|
60.5
|
|
2006
|
387669.4
|
52.0
|
186342.4
|
23.8
|
48.0
|
201327.0
|
92.4
|
51.9
|
82.8
|
|
2007
|
413928.0
|
6.7
|
181881.2
|
-2.3
|
43.9
|
232046.8
|
15.2
|
56.0
|
84.2
|
|
2008
|
472995.0
|
14.2
|
173519.1
|
-4.5
|
36.6
|
299475.9
|
29.0
|
63.3
|
95.5
|
|
2009
|
595975.2
|
26.0
|
215650.3
|
24.2
|
36.1
|
380325.0
|
26.9
|
63.8
|
30.6
|
|
2010
|
625159.4
|
4.8
|
157817.5
|
-26.8
|
25.2
|
467341.9
|
22.8
|
74.7
|
30.2
|
|
2011
|
820068.2
|
31.1
|
434485.5
|
175.3
|
52.9
|
385582.7
|
-17.4
|
47.0
|
38.0
|
|
2012
|
1114379.1
|
35.8
|
568277.1
|
30.7
|
50.9
|
546102.0
|
41.6
|
49.0
|
55.3
|
|
2013
|
996724.6
|
-10.5
|
425526.5
|
-25.1
|
42.6
|
571198.1
|
4.5
|
57.3
|
50.5
|
|
2014
|
1362785
|
36.7
|
609400.0
|
43.2
|
44.7
|
753385.0
|
31.8
|
55.2
|
67.0
|
|
2015
|
1606800
|
17.9
|
628837.0
|
3.1
|
39.1
|
977963.0
|
29.8
|
60.8
|
75.3
|
|
2016
|
2087087
|
29.8
|
684808.0
|
8.9
|
32.8
|
1402279
|
43.3
|
67.1
|
97.5
|
|
2017
|
2208140
|
5.8
|
695870.0
|
1.6
|
31.5
|
1512270
|
7.8
|
68.5
|
102.7
|
|
2018
|
2387753
|
8.1
|
654543.0
|
-5.9
|
27.4
|
1733210
|
14.6
|
72.6
|
109.7
|
|
2019
|
2319882
|
-2.8
|
553432.0
|
-15.4
|
23.9
|
1766450
|
1.9
|
76.1
|
106.1
|
|
Compound growth
|
17.5
|
|
13.5
|
|
|
19.7
|
|
|
|
From table 2, the development of total revenues during the period 2000–2005, increased from 92,315.7 to 255,000.3 billion riyals and an annual growth rate of 22.6%. For 2005, while the ratio of the contribution of oil revenues to general revenue increased to 58.9% in 2005. Compared to the contribution of non-oil revenues to public revenue of 41.0%, for the same year, this period is characterized by the establishment of the (Oil Fund to stabilize the economy) under the management of the Central Bank as a mechanism for controlling oil revenues, the task of which is to stabilize the annual budgets and finance private sector projects mixed in hard currency through investment banks as explained earlier in the development plan.
During the period 2006–2010, the ratio of non-oil income contribution to general revenues grew to the highest contribution in 2010 of 74.7% of public revenues and an annual growth rate of 22.8%, compared to the contribution of oil revenues from public revenues. The 25.2, the reason for the development plan 2005–2010 mentioned earlier is to raise the value of non-oil exports by allocating $473 billion, with the private sector's share of these investments 58.8%.
As a result of the crisis of Iran's nuclear program with the major powers and the imposition of international sanctions on the Iranian economy, which led to a decline in public revenues, especially in 2013, revenues 996,724.6 reached 1billion riyals compared to 2012 and a low growth rate of 10.5%. This is due to the decline in oil revenues and a low growth rate of 25.1%. In 2013, non-oil revenues recorded a positive growth rate of 4.5 percent. If Iran has worked to contain the negative effects of economic sanctions by supporting non-oil exports, which it relies on as an alternative to oil and expanding the tax base [1, p. 1–2] (Abdelhamid Marget, 2019, р. 1–2).
After 2013 and the lifting of the embargo on the Iranian economy, Iran increased oil and non-oil exports, reduced the cost of trade and international financial transactions and the return of foreign investment, [15, p 11–12], the balance of foreign investment flows incoming to it reached $43 billion by the end of 2014. The Fund's oil and gas revenues to invest in strategic projects as well as financing private sector projects as stipulated in the development plan 2010–2015 mentioned earlier all this led to an increase in public revenues for the last three years until 2016 to 2,087,087 billion riyals with a positive growth rate of 29.8 percent. While oil and non-oil revenues also achieved positive growth rates, after 2016, oil revenues began to decline in contrast to the increase in non-oil revenues, and the reason was due to what the Corona pandemic had brought about and the decrease in global oil prices, as well as the US sanctions on Iran. We note from the table 2 that non-oil revenues represent the main resource in financing the general budget, while the composite growth rate for the period 2000–2019 for general revenues 17.5%, and the index of the ratio of the total revenue of GDP, the ratios mentioned in table 2 indicated that it had increased since 2000, except for some years as a result of the crisis in the nuclear program and the sanctions imposed on Iran, as the revenue ratios of output decreased as described in the table 2, and that the high percentage of general revenue from this output is evidence of the large role of these revenue in GDP growth is evidence of economic diversification.
The contribution of oil and non-oil exports to the total exports of the State of Iran
Foreign trade is an important part of economic activity in Iran, and oil exports play an important role in total exports, i.e. they contribute to shaping the Iranian economy and significantly affect economic growth, and therefore these exports are the main channel that reduces the state of national income default slackness of national spending under national accounts through the role of oil exports, which is a cover for Iran’s increased imports [18, p. 111] (Mohammad Aqai, 2002, р. 111), as well as the change in the foreign balance of money and balance of payments. In addition to its effects in the front and backlinks with different sectors of the economy both their medium and long-term effects [2, p. 87] (Adnan Mohammad Daoud, Adel Salam Kashkul, 2017, р. 87). From the table 3, oil exports dominate total Iranian exports for most of the study period, with oil exports rising from $24,226 million in 2000 to $81.855 million in 2008, and a contribution of 81.7 percent. For 2008, this increase in oil exports was reflected in the rise in the value of total exports, as these exports grew to $100,571 million in 2008, compared to a decrease in the contribution of non-oil exports to total exports of 18.1%
Oil exports declined in 2009 [20, р. 33] (Nabil Jaafar Abdul Ridha, 2000, р. 33) due to the global crisis and low oil prices on the international market, reaching $69.825 million compared to 2008, reflecting a negative impact on the decline in total exports for the same year to 87,534 compared to 20 08 The share of oil exports for total exports for the year decreased to 79.7 while the contribution of non-oil exports increased to 20.2 in 2009 compared to 2008, and after 2009 took both totals, oil, and non-oil exports. Until 2012, both oil exports and total exports began to decline due to the crisis of Iran's nuclear program with major countries and the imposition of international sanctions on the Iranian economy and continued this decline until 2015 as a result of the fall in the price of oil to 50 dollars. This reduced the contribution-to-total export ratio to the lowest level 51.9% in 2015, against a gradual increase in the ratio of non-oil export contributions to total exports to reach the highest contribution ratio 48.0%. In 2015, Iran contained the negative effects of economic sanctions by supporting non-oil exports on which it depended as an alternative to oil 42. In 2018, the value of total exports rose to 98.103 as a result of the rise in oil exports to 66.872 after the decline in 2015 as a result of the resumption of Iranian oil exports following the implementation of the nuclear agreement, which confirms the correlation of Iranian commodity exports to the nature of the international market and trends in crude oil demand abroad as Iran is a rentier country and therefore it makes sense to note the increase in exports compared to non-oil exports in Iran despite its high capacity In economic diversification, including for a number of reasons, including that it is an oil country producing large quantities of crude oil and that crude oil prices have taken it up, it makes sense that the volume of oil exports will become very large compared to non-oil exports, the second issue is related to international sanctions imposed on Iran, including non-oil exports of goods and services, except crude oil, which is necessary to counter the increase in the global demand for crude oil.
Table 3
Percentage of the contribution of oil and non-oil exports to total exports to the State of Iran for the period of (2000–2019) ($1 million)
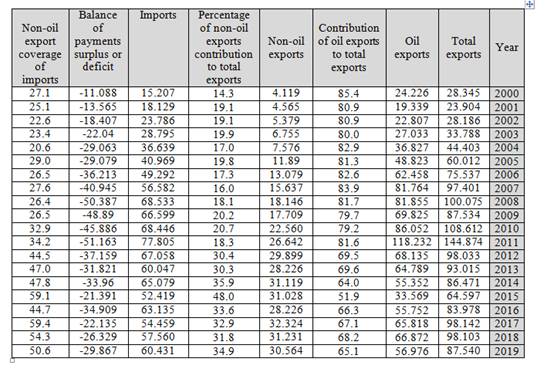
Source: From the work of the researcher based on: Central Bank of Iran Annual Review 2000–2019.
It should be noted from table 3 that this percentage increases throughout the study, the ratio of coverage of non-oil exports to imports 27.1 was estimated in 2000, and the ratio decreased for the period from 2000 to 2008 and was recorded at the end of 2008 26.4%, after which it began to take an upward trajectory due to government reform programmers that emphasize the need not to rely on crude oil exports to finance the state budget if the coverage of non-oil exports to total imports reached its highest level 50.6 in 2019. As shown in the table 3.
Conclusions
(1) The imposition of economic sanctions on Iran has had a major impact on the release of many structural and structural imbalances.
(2) The Iranian economy's attempt to diversify its economy was not by accident, but as a result of the circumstances it had experienced, so it became inevitable to develop other productive sectors.
(3) The private sector has an important role in diversifying the Iranian economy and rising GDP growth rates.
(4) Economic development plans have a key role to play in raising the value of non-oil output because of the expansion of these plans in reducing dependence on the oil sector, encouraging the private sector, and increasing the contribution of steel and iron industries.
Recommendations
(1) The need for other rent countries, in which the oil sector is the basis of which is the Iranian experience in how to diversify their sources of income.
(2) As a result of Iran’s important sectors, including the agricultural and industrial sectors, its development and development is very important, by adopting the principle of competition of goods abroad to export surplus and working to diversify the export structure and not just to export oil.
(3) The need for Iran to integrate with the world economy and expand its investments with many countries to obtain new markets for the disposal of its products.
Источники:
2. Adnan Mohammad Daoud, Adel Salam Kashkul The impact of some economic variables on The Iranian GDP for the duration (1992-2014) standard study // Al-Kut journal of administrative and economic sciences, Wasit University, Faculty of Management and Economics. – 2017. – № 26.
3. Ahmed Jassim Mohammed Analysis and Evaluation of Economic Reform Policies in Iran. / Ph.D. Thesis, College of Economics and Administration. - Basra University, 2006.
4. Ahmed Shamseddine Laila The future of Iran's economy after the lifting of international sanctions. The International Institute for Iranian Studies, 25 May 2016. [Электронный ресурс]. URL: https://rasanah-iiis.org (дата обращения: 20.12.2020).
5. Akbar Kamigani Exchange Rate Unification Strategy, Central Bank of Iran // Rond Magazine, Tehran. – 2003. – № 38.
6. Assessment of the Iranian economy for the duration (2000-2010). [Электронный ресурс]. URL: http://www.freepatentsonline.com/article/Review-Business-Research/2939502 (дата обращения: 22.12.2020).
7. Central Bank of the Islamic Republic of Iran, Economic Report, Issue 269, 1993
8. Central Bank of the Islamic Republic of Iran, Annual Review, 2015
9. Central Bank of the Islamic Republic of Iran, Economic Report and Balance, Sheet 1383 (April, 2004)
10. Development Organization of the Islamic Republic of Iran, Industrial Sector Survey on the Potential for Non-Oil Manufactured Exports, 1999
11. Hadi Salehi Esfahanim, Kamiar Mohaddes Oil Exports and the Iranian Economy // Journal of Iranian Studies. – 2009. – № 11.
12. Hossein Ali Hashim Reality and The Possibility of Sustainability of The Leading Sectors of the Iranian Economy // Journal of Iranian Studies. – 2012. – № 15.
13. Hossein Shenaw a Majid The Relationship between budget deficit and monetary change in selected countries with a special reference to Iraq. / Doctoral Thesis. - Kufa University, 2016.
14. Indicators of the Iranian economy, current challenges and corruption rates (Part 1), Al Mazmaa Center for Studies and Research, Iranian Orbits Magazine - Arab Democratic Center - Berlin, Germany, Volume 02, Issue 05, September 2019
15. World economic outlook database, 2015. International Monetary Fund. [Электронный ресурс]. URL: https://www.IMF.org (дата обращения: 22.12.2020).
16. Kamiar Mohaddesa, M. Hashem Pesaran , One Hundred Years of Oil Income and the Iranian, Economy: A Curse or a Blessing. - Faculty of Economics and Girton College, University of Cambridge, UK, 2012.
17. Louis Hobeika Iranian economy from sanctions to development // Issues and looks Quarterly report. – 2016. – № 1.
18. Mohammad Aqai Analysis and Criticism of some of Iran's tax reforms and direct tax law, // Economic Magazine. – 2002. – № 7.
19. Mohammed Saeed Abdel Momen Foreign Policy under Khatami's presidency, series of special reports // 10th issue, Arab Center for Strategic Studies Beirut. 1977.
20. Nabil Jaafar Abdul Ridha Impact of Exports on Economic Growth in Iran // Journal of Iranian Studies. – 2000. – № 3.5.
21. Tamer Badawi Iran's rentier state: Oil revenues growth and inflation // Al-Jazeera Studies Center reports, Fifth Issue, June. 2014.
Страница обновлена: 29.07.2026 в 09:02:39
Download PDF | Downloads: 37
The Iranian strategy to diversify sources of income to get out of the characteristics of the rentier economy
Nour A.S.Journal paper
Journal of International Economic Affairs
Volume 11, Number 1 (January-March 2021)
Abstract:
The author of the article explains the reality of the Iranian economy and clarifies the most important plans and mechanisms necessary for the success of the economic diversification policy in Iran to raise the level of economic growth in it and get rid of the rentier character.
Keywords: rural economy, economic diversification, GDP, strategic planning
JEL-classification: O11, O40, O53
References:
Abdelhamid Marget (2019). Iran's experience in promoting non-oil exports Iranian Orbits Magazine. (3).
Adnan Mohammad Daoud, Adel Salam Kashkul (2017). The impact of some economic variables on The Iranian GDP for the duration (1992-2014) standard study Al-Kut journal of administrative and economic sciences, Wasit University, Faculty of Management and Economics. (26).
Ahmed Jassim Mohammed (2006). Analysis and Evaluation of Economic Reform Policies in Iran
Ahmed Shamseddine Laila The future of Iran's economy after the lifting of international sanctionsThe International Institute for Iranian Studies, 25 May 2016. Retrieved December 20, 2020, from https://rasanah-iiis.org
Akbar Kamigani (2003). Exchange Rate Unification Strategy, Central Bank of Iran Rond Magazine, Tehran. (38).
Assessment of the Iranian economy for the duration (2000-2010). Retrieved December 22, 2020, from http://www.freepatentsonline.com/article/Review-Business-Research/2939502
Hadi Salehi Esfahanim, Kamiar Mohaddes (2009). Oil Exports and the Iranian Economy Journal of Iranian Studies. (11).
Hossein Ali Hashim (2012). Reality and The Possibility of Sustainability of The Leading Sectors of the Iranian Economy Journal of Iranian Studies. (15).
Hossein Shenaw a Majid (2016). The Relationship between budget deficit and monetary change in selected countries with a special reference to Iraq
Kamiar Mohaddesa, M. Hashem Pesaran (2012). , One Hundred Years of Oil Income and the Iranian, Economy: A Curse or a Blessing
Louis Hobeika (2016). Iranian economy from sanctions to development Issues and looks Quarterly report. (1).
Mohammad Aqai (2002). Analysis and Criticism of some of Iran's tax reforms and direct tax law, Economic Magazine. (7).
Mohammed Saeed Abdel Momen (1977). Foreign Policy under Khatami's presidency, series of special reports 10th issue, Arab Center for Strategic Studies Beirut.
Nabil Jaafar Abdul Ridha (2000). Impact of Exports on Economic Growth in Iran Journal of Iranian Studies. (3.5).
Tamer Badawi (2014). Iran's rentier state: Oil revenues growth and inflation Al-Jazeera Studies Center reports, Fifth Issue, June.
World economic outlook database, 2015International Monetary Fund. Retrieved December 22, 2020, from https://www.IMF.org