On the Effect of the Russian Ruble Exchange Rate on the Economic Growth Dynamics
Korishchenko K.1
1 The Russian Presidential Academy of National Economy and Public Administration, ,
Скачать PDF | Загрузок: 39
Статья в журнале
Global Markets and Financial Engineering ()
Аннотация:
In the post-crisis period (2009-2014), there has been a significant difference in the dynamics of Russia’s GDP and that of other major economies in the world. This article is devoted to the study of the factors that have influenced the formation of this trend and the prospects of change in the current situation. The article examines the monetary and exchange rate policy of the Central Bank as a key factor determining the present and the near-term situations. It has been concluded that the transition to a floating exchange rate and inflation targeting largely determined the formation of this trend. The author discusses the problem requiring the quickest solution - what changes should be introduced into the existing policies in order to change the established negative trends.
The post-crisis period and monetary easing of the world Economy
After the 2008 financial crisis, the world economy has moved to a new development phase based primarily on the vigorous issuing activity of the central banks of the world’s largest economies – the US, China, Europe, and Japan.
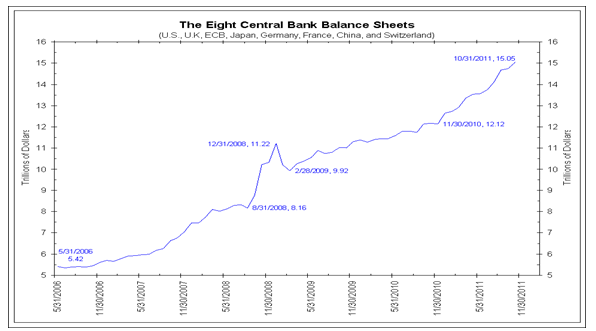
Figure 1. Volumes of money issues of the world’s largest central banks
(source - www.ritholtz.com)
Over the period of 2008-2012, the volume of money issuing by 8 largest central banks of the world tripled - from $ 5 trillion it increased to $ 15 trillion. (See Fig. 1)
Over the last years this trend has begun to slow down in certain countries (the USA, the UK), and it has transited into a more active phase in some of the others (Eurozone, Japan, China).
The success of this policy is still a matter of debate, but nevertheless, over the period of 2012-2014 there was a certain positive dynamics of growth of real GDP in the US and the UK, China also maintained its high growth rates. (See Fig. 2).
Against this background, Russia has shown a downward trend in the dynamics of GDP.
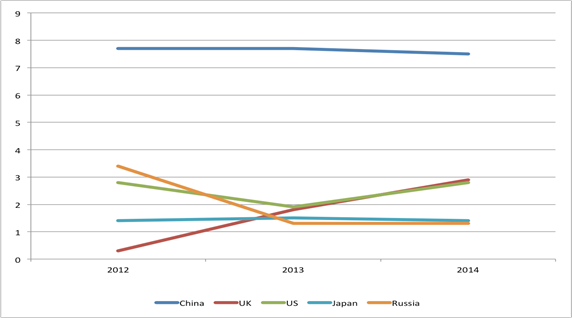
Figure 2. The Dynamics of real GDP growth in world’s major economies in 2012-2014 (estimate)
(source - www.imf.org)
1. GDP and its constituents. The dynamics analysis.
As already mentioned, there has been a clear downward trend in the GDP growth of the Russian economy over the past three years, and in 2014, there was a transition into the phase of “near-zero” growth rate. (See Fig. 3)
|
|
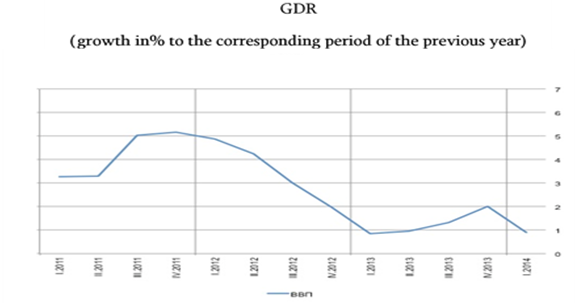
Figure 3. Dynamics of Russia’s GDP (quarterly)
(source - www.cbr.ru)
Taking the classic definition of GDP (1) as a basis, let us consider how each of the constituents has affected the GDP dynamics.
GDP = C + G + I + NX (1)
The first factor (C) is consumption (Fig. 4). It is possible to take the dynamics of salaries and retail turnover as good indicators of the behavior of this ratio. They characterize the consumption behavior of the population, both in terms of disposable income and its practical spending. The downward trend in both ratios since the end of 2011 has been very strong.
|
|
|
|
|
|
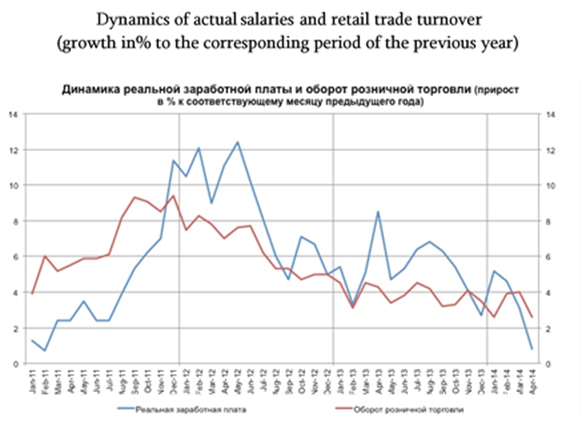
Figure 4. Dynamics of salaries and retail trade turnover
(source - www.cbr.ru)
The next factor is government spending (G) (Fig. 5). This indicator has an upward trend, but its growth rate is slowing down and, as will be shown below, the quantitative increase of this indicator is not sufficient to compensate for the decline or slowdown in other GDP constituents.
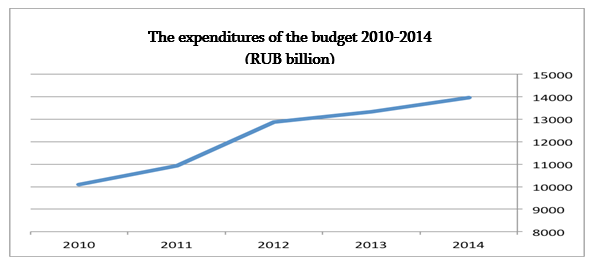
Figure 5. The expenditures of the Russian Federation budget for the period of 2010-2014
(source - minfin.ru)
In the recent years, the investment activity (I) of the Russian business has precipitously decelerated, and growth rates have even moved into the negative plane (Figure 6). The dynamics of construction, one of the most significant investment constituents, actually confirms, if not determines, the same trend.
![]()
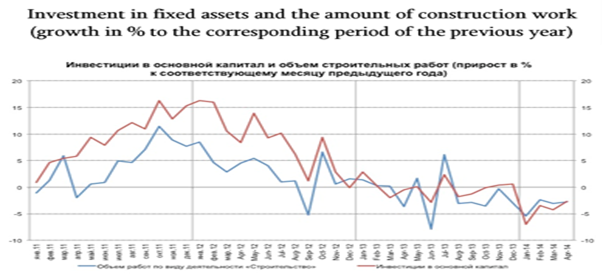
Figure 6. Investment activity in the period 2011-2014
(source - www.cbr.ru)
One of the reasons for this decline is the ongoing decline in the amount of profit in the key sectors of the Russian economy, with the exception of mining (Fig. 7). At the same time, the industry usually “feels” much better compared to the others in case of ruble depreciation. However, we do not see any visible improvement of profitability over the specified period even in the mining industry.
![]()
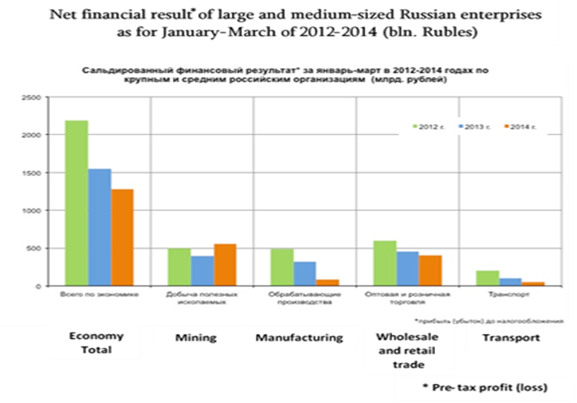
Figure 7. The profitability of large and medium-sized businesses for Quarter I of 2012-2014
(source - www.cbr.ru)
And finally, the rate of net exports (X). Its dynamics is represented in the diagram Fig. 8.
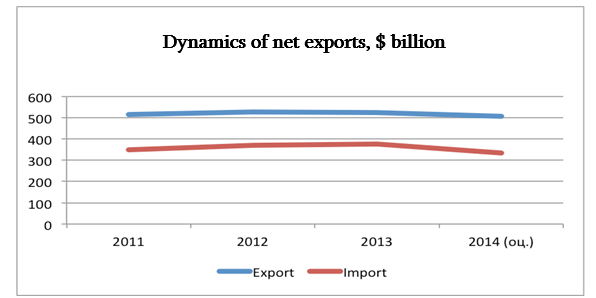
Figure 8. Dynamics of net exports
(source - www.principalglobalindicators.org)
Summarizing the above trends, it is fair to say that all the GDP constituents, with the exception of government spending, do not make a positive contribution to growth. Given the rigidity of all the GDP constituents and the fact that only government spending is controlled directly by the government, only an increase in government spending can improve the developing situation in the short term.
2. Monetary policy and inflation
Since we have examined the ability of the government to influence the dynamics of economic growth in the previous section, it would be logical to consider the impact of money issue on the same process in this one.
For this purpose, we can use Fisher equation:
mV = PQ (2)
or its alternative variant
Q = (m/P) * V (3)
It should be noted that the formula is not applicable to direct quantitative analysis, but it can be used to analyze trends and relationships.
Assuming that the circulation velocity V (at m = M2) remains unchanged in the short period under consideration, it can be stated that Q (which is a proxy for GDP) will increase or decrease at a rate at which monetary growth m = M2 exceeds the price level growth P = CPI.
Over the recent years, the monetary policy pursued by the Bank of Russia has been having a strong anti-inflationary direction and is characterized by slowdown in growth of the main monetary aggregates – for example, at M2 from 30% to 10%. (Fig. 9)
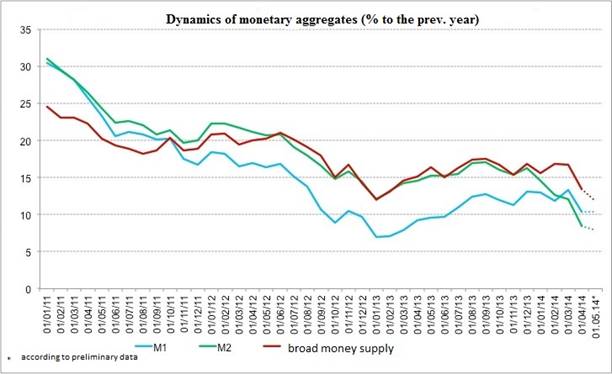
Figure 9. Dynamics of monetary aggregates for the period of 2011-2014 (source - www.cbr.ru)
At the same time, there has not been a significant reduction in inflation and, therefore, it can be assumed that the reduction in the growth rate of the money supply has decreased the economic growth rather than gave a tangible anti-inflationary effect (Fig. 10).
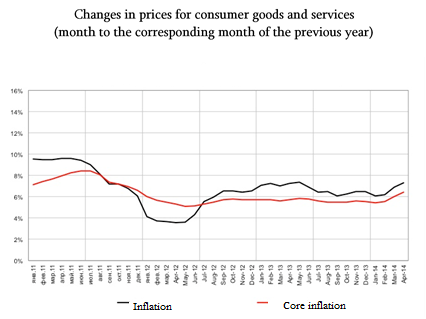
Figure 10. Dynamics of inflation for the period of 2011-2014
(source - www.cbr.ru)
Given the fact that the credit multiplier remained practically unchanged during this period, the growth rate of the money supply was almost entirely determined by the dynamics of the monetary base which is under the direct control of the Central Bank (first of all, by the exchange rate policy, and later - by the interest rate policy - due to gradual transition to a floating exchange rate.
3. How did these changes affect the growth rate of the money supply?
Starting from 2002 (the beginning of the increase in oil prices), net international reserves (NIR) have been the constituent responsible for the increase in the volume of money in the structure of the monetary base, while net domestic assets (NDA) have acted as a monetary sterilization factor (Fig. 11).
However, after the crisis, the situation has changed, and the boosting of NIR has ceased. The NDA have not been able to “pick up the baton” and, thuswise, over the last 3-4 years, the money supply growth has slowed down significantly.
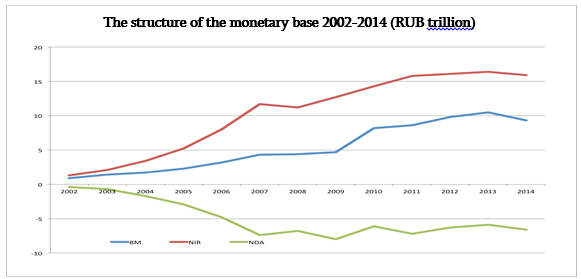
Figure 11. The structure of the monetary base in 2002-2014
(source - www.cbr.ru)
Figure 12 presents data on the supply of monetary stock with foreign-exchange reserves. These data can serve as a vivid illustration of these changes.
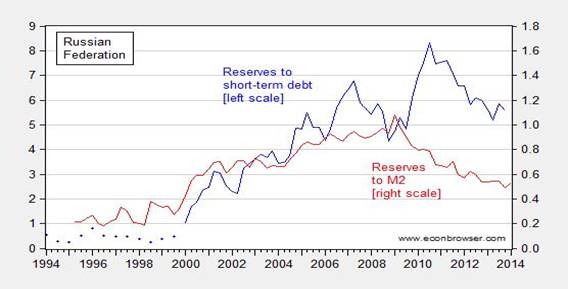
Figure 12. Reserves and money supply (M2) for the period of 1994-2014 (forecast)
(source - econbrowser.com)
The conclusion that follows from the presented diagram is that the level of coverage of the money supply had been growing until the crisis year 2008, and in 2008, a clear downward trend formed in the dynamics of the coverage ratio of M2 by money supply reserves. Preservation of this trend will sooner or later entail a significant weakening of the national currency.
4. The balance of payments and exchange rate
The problem of “monetary contraction” described in the previous section can be explained through the prism of the balance of payments.
At the beginning of the analysis, let us consider the dynamics of turnovers (in absolute balance of incoming and outcoming flows) by balance of payment accounts (Fig. 13)
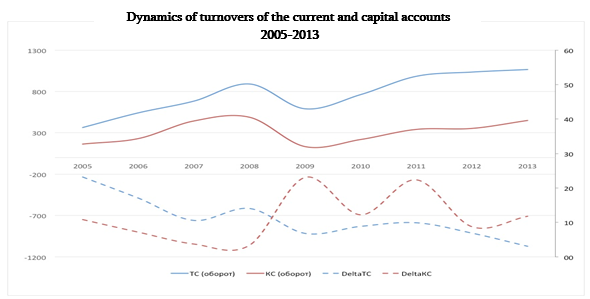
Figure 13. Dynamics of turnovers of the current and capital accounts for 2005-2013
(source - www.cbr.ru)
Based on the diagram data, the following conclusions can be made:
- turnovers on both accounts tend to rise, and the current account is ahead of the capital account in growth rate, which evidences a relative reduction of the role of cross-border capital transactions in Russia’s relations with the rest of the world, despite the liberalization of foreign exchange in 2006;
- however, the ratio of the account balance to its turnover (right axis) is steadily decreasing for the current account and remains in a sideways trend for the capital account. This means that the export and import turnovers, growing in monetary terms, are less and less impacting on the current account balance. In this case, the balance of the capital account remains highly volatile and increases its influence on the change in foreign exchange reserves.
Based on this, it can be concluded that the role of the capital account as a factor, affecting the balance of payments and the change in reserves, increases and, thus, its role as a component forming the money supply increases as well.
Let us consider the current account balance in more detail (Fig. 14)
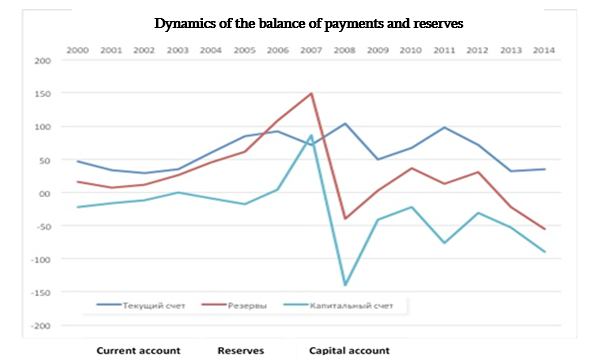
Figure 14. Dynamics of the balance of payments and reserves for the period 2000-2014 (forecast)
(source - www.cbr.ru)
Analysis of the data presented in the diagram leads to the following conclusions that in this period there is:
- a relatively stable sideways trend in the current account;
- a clear correlation between the dynamics of the capital account and reserves, which supports the conclusion about the increasing role of the capital account;
- a significant surge in capital inflows after liberalization of currency regulation (2006);
- a sharp capital outflow immediately after the 2008 crisis;
- a downward trend of the capital account and reserves after 2009.
Ultimately, the downward trend of the capital account and the stagnant dynamics of the current account entail a decrease in the gold and forex reserves (GFR).
Besides the effects of the crisis, such course of events is explained by gradual change of the model of monetary policy pursued by the Bank of Russia and coincides with the downward trend of the capital account balance. The model, which was implemented in the period of 2003-2007, was based on the exchange rate management with a tendency to smooth strengthening of the ruble and, in this connection, the purchase of foreign currency was the main source of the ruble issuing.
The change in the monetary policy consisted in the transition to a floating rate which actually led to the weakening (the trend - up to 10-20% per year) of the ruble due to the relatively high Russian inflation and relatively low rates of domestic money and bond market. This, in turn, supported a steady trend of capital outflows.
In addition, after 2008, the increase of the current account stopped and changed to a bearish trend. Such dynamics of the current account resulted mainly from the change in the terms of trade.
5. Conclusions
The following main conclusions can be drawn from the analysis conducted:
1. The change of the model of currency and monetary policies has led to capital outflows and weakening of the capital account.
2. Adverse changes in the terms of trade have “frozen” the state of the current account.
3. Relatively stringent fiscal policy has not made a significant contribution to the growth of the money supply.
4. The process of reforming the banking system, which began in 2013-2014, has “frozen” the money multiplier.
5. All of the above factors have led to stagnation of the volumes of money supply and, in effect, to monetary contraction.
6. As one of the consequences, there has been a sharp slowdown in the GDP growth.
Given the essence of the above problems and on the basis of this analysis, it is possible to offer the following changes to improve the situation:
1. The fiscal policy can be changed primarily through the use of funds.
2. Positive result can be achieved through the increase of public borrowing that will lead, in addition to the growth of budget expenditures, to the increase of the collateral pool.
3. However, given the limited availability of funds and the rigidity of the system of government borrowing, money issue should be the main instrument.
4. First of all, it is necessary to change the exchange rate policy, as a floating exchange rate in combination with high interest rates results in a smooth and steady devaluation. This policy itself constantly stimulates capital outflow.
5. This can be exemplified by the fact that the main recipients of capital - export-oriented companies - have reduced their investment activities; in fact, they are investing profits in foreign currency assets to generate additional revenue. In fact, the same benefit has been derived by the Russian budget in 2014 due to the weakening of the ruble.
6. It is also necessary to revise the interest rate policy, as high rates in Russian conditions are not sufficient to reduce inflation, since it largely depends on the regulated prices and is not fully controlled from the Central Bank. And in order to turn the capital outflow into the inflow under a floating exchange rate, the rate should be considerably double-digit, which will effectively block the channel of bank lending.
Страница обновлена: 26.04.2026 в 19:07:03
Download PDF | Downloads: 39
On the Effect of the Russian Ruble Exchange Rate on the Economic Growth Dynamics
Korischenko K.Journal paper
Global Markets and Financial Engineering
Abstract:
In the post-crisis period (2009-2014), there has been a significant difference in the dynamics of Russia’s GDP and that of other major economies in the world. This article is devoted to the study of the factors that have influenced the formation of this trend and the prospects of change in the current situation. The article examines the monetary and exchange rate policy of the Central Bank as a key factor determining the present and the near-term situations. It has been concluded that the transition to a floating exchange rate and inflation targeting largely determined the formation of this trend. The author discusses the problem requiring the quickest solution - what changes should be introduced into the existing policies in order to change the established negative trends.
Keywords: 0