Measuring the relationship of the impact of some indicators of financial services on bank failure in Iraq for the period (2011-2021)
Ghaleb Shaker Bahit1, Adel Salam Kashkool1, Falah Thamer Alwan2
1 College of Administration and Economics, University of Wasit, ,
2 Kut Technical institute, Middle Technical University, ,
Скачать PDF | Загрузок: 48
Статья в журнале
Экономические отношения (РИНЦ, ВАК)
опубликовать статью | оформить подписку
Том 13, Номер 4 (Октябрь-декабрь 2023)
Эта статья проиндексирована РИНЦ, см. https://elibrary.ru/item.asp?id=56006516
Аннотация:
The article aims at analyzing the relationship between some indicators of financial services, their level of quality, and bank failure, and how the improvement of these services avoids the banking sector falling into some risks and crises, the most important of which is the failure of borrowers or their inability to pay their financial obligations, which results in an impact on the effectiveness of the banking system and the smoothness of banking services provided to customers. The ARDL methodology was used to analyze the standard relationship and interpret it economically. The results of the standard tests showed that the appropriate model is (1, 0, 0, 2), that is, with a single slowing period for the banking default variable, which is an internal variable, and without slowing periods for each of the banking spread and electronic payment services variables, with two slowing periods for the banking depth variable.
Ключевые слова: financial services, bank failure, electronic payment services
JEL-классификация: F34, F38, G21
Introduction
The financial services index and its quality is one of the determinants of improving the performance of the banking sector, and contributes to reducing bank defaults and credit risks. The impact of credit risks goes beyond the instability of the banking sector, as it has an impact on economic stability. Commercial banks face the risks of inability to pay and financial obligations according to their timing, so there is a correlation between the quality of financial services and bank failure, as the direction of this relationship is determined by the nature and efficiency of the banking sector and the degree of its concentration in the economic field.
The problem of the study determines what is the nature of the relationship between financial services and banking failure?, and whether the banking sector suffers from poor quality of financial services. The importance of the study is evident in addressing the impact of some financial services indicators on bank failure, which is a product of financial inclusion policies, and providing access to most segments of society, and the impact of that on bank failure in its credit and investment policies. The study also assumes the existence of a relationship between indicators of financial services and their quality, and the impact of this on bank failure. The direction of this relationship is determined by the effectiveness and efficiency of the banking sector.
The study aims to clarify the concept of financial services and bank default, measure and analyze the relationship of some financial services indicators to bank default in Iraq for the period 2021-2022, as well as the benefit of banking institutions from this study and its standard results, by identifying early warning elements to avoid crises or mitigate their severity.
Interview:
Firstly: financial services and banking failure (a theoretical concept).
The advanced technology in the field of financial services has a tangible impact on improving the performance of the banking sector, and avoiding falling into banking crises, the most important of which is stumbling, through the element of innovation, creativity and development of communication, with the aim of raising the quality and sustainability of banking services, as a service to customers. Financial services are the products and services provided by banks through financial methods and transactions, such as loans, insurance, credit cards, investment opportunities and money management, in addition to the information they provide about the nature of the financial and banking market, and the changes that occur in financial markets, which leads to improving the performance of banking transactions and increasing its comprehensiveness. Specialists define financial services as a group of intermediary organizations between investors and banking institutions, which is evident in (1) raising savings efficiency and promoting investment activities..
Among the most important advantages offered by financial services are as follows [10, ]:
ü Enhance liquidity.
ü Mediation between savers and investors.
ü Providing job opportunities.
ü Reducing the cost of transactions and lending.
ü Contribution to the gross domestic product.
ü Improving the performance of banks.
ü Improving financial depth.
ü Avoid crises and banking risks.
ü Reducing the phenomenon of non-performing loans.
Therefore, the quality and quality of financial services may contribute to achieving stability in the banking system, reduce the severity of banking crises, encourage risk management and improve financial performance in general, and maximize banks' profitability through the creation of high-quality banking assets.
As for bank failure, it is considered one of the indicators of the instability of the financial system and weak banking performance. It represents one of the risks that affect the financial and banking sector, and then this is reflected on macroeconomic indicators [9, ].
So non-performing loans are one of the most important indicators that reflect financial instability, by enabling investors to appropriately invest their money, as they can know and identify banks that are characterized by low rates of default, which indicate that they are low-risk investments, if compared to those with high rates. .
There is a clear correlation and impact between the diversity of financial and banking services and their quality on the performance of banks and the reduction of defaults. Technological progress, especially in communications and computer systems, which allowed the transfer of funds and information at a low cost from one account to another, or between banking and non-banking institutions, as the abundance of these means Overcoming some barriers, in addition to the fact that the development of financial services gave some banks a competitive advantage outside their home countries and traditional product markets, as well as enabled many companies to provide sophisticated and non-traditional financial services, and thus companies expanded and diversified their services, which was reflected on the basis of competition and the development and expansion of the financial services industry [6,].
Secondly: the applied side of the study:
In order to reach the objectives of the research, it is necessary to ensure that the time series under study meets the standard and statistical conditions in order to be subjected to various tests and to choose the appropriate methodology with the statistical model, and accordingly the annual time series was converted to the quarterly series, in order to increase the number of observations and then reach the size With which it is possible to start the analysis process, the sample consisted of four indicators mentioned in Table (1), and these indicators were coded as in the table below:
Table (1) Some selected banking indicators for the period 2011-2021
|
YEARS
|
banking spread
|
Electronic payment services
|
banking depth
|
Bank default / to the total credit
|
YEARS
|
banking spread
|
Electronic payment services
|
banking depth
|
Bank default / to the total credit
|
|
code
|
A
|
B
|
C01
|
D01
|
code
|
A
|
B
|
C01
|
D01
|
|
2011Q1
|
2.77
|
1.07
|
6.13
|
4.94
|
2016Q3
|
2.70
|
0.91
|
9.16
|
9.77
|
|
2011Q2
|
2.78
|
1.07
|
5.95
|
4.01
|
2016Q4
|
2.53
|
0.96
|
9.02
|
9.66
|
|
2011Q3
|
2.78
|
1.07
|
5.81
|
3.33
|
2017Q1
|
2.39
|
1.15
|
8.81
|
8.43
|
|
2011Q4
|
2.79
|
1.07
|
5.72
|
2.92
|
2017Q2
|
2.29
|
1.28
|
8.62
|
8.49
|
|
2012Q1
|
2.80
|
1.07
|
5.67
|
2.77
|
2017Q3
|
2.22
|
1.42
|
8.40
|
8.83
|
|
2012Q2
|
2.81
|
1.07
|
5.66
|
2.88
|
2017Q4
|
2.18
|
1.58
|
8.17
|
9.45
|
|
2012Q3
|
2.83
|
1.07
|
5.70
|
3.26
|
2018Q1
|
2.26
|
1.84
|
7.70
|
11.97
|
|
2012Q4
|
2.84
|
1.07
|
5.78
|
3.89
|
2018Q2
|
2.26
|
2.01
|
7.52
|
12.50
|
|
2013Q1
|
2.80
|
1.12
|
5.58
|
5.92
|
2018Q3
|
2.26
|
2.16
|
7.41
|
12.67
|
|
2013Q2
|
2.85
|
1.10
|
5.88
|
6.63
|
2018Q4
|
2.26
|
2.31
|
7.37
|
12.46
|
|
2013Q3
|
2.91
|
1.06
|
6.35
|
7.16
|
2019Q1
|
2.26
|
2.45
|
6.92
|
10.87
|
|
2013Q4
|
3.00
|
1.00
|
7.00
|
7.49
|
2019Q2
|
2.25
|
2.56
|
7.20
|
10.33
|
|
2014Q1
|
3.17
|
0.75
|
8.79
|
7.07
|
2019Q3
|
2.25
|
2.67
|
7.74
|
9.83
|
|
2014Q2
|
3.28
|
0.73
|
9.41
|
7.26
|
2019Q4
|
2.24
|
2.76
|
8.53
|
9.37
|
|
2014Q3
|
3.40
|
0.76
|
9.81
|
7.50
|
2020Q1
|
2.22
|
2.71
|
11.19
|
8.65
|
|
2014Q4
|
3.52
|
0.84
|
9.99
|
7.78
|
2020Q2
|
2.21
|
2.83
|
11.86
|
8.38
|
|
2015Q1
|
3.87
|
1.26
|
9.45
|
8.26
|
2020Q3
|
2.21
|
2.98
|
12.13
|
8.27
|
|
2015Q2
|
3.90
|
1.34
|
9.42
|
8.57
|
2020Q4
|
2.20
|
3.17
|
12.02
|
8.31
|
|
2015Q3
|
3.83
|
1.36
|
9.38
|
8.85
|
2021Q1
|
2.20
|
3.39
|
11.52
|
8.51
|
|
2015Q4
|
3.67
|
1.32
|
9.34
|
9.12
|
2021Q2
|
2.20
|
3.65
|
10.63
|
8.87
|
|
2016Q1
|
3.12
|
0.95
|
9.35
|
9.62
|
2021Q3
|
2.20
|
3.95
|
9.36
|
9.38
|
|
2016Q2
|
2.89
|
0.90
|
9.27
|
9.75
|
2021Q4
|
2.20
|
4.29
|
7.69
|
10.05
|
1. Stability test (UNIT ROOT TEST) [3,]:
The standard analysis begins with the pre-stage of the statistical tests, which includes the stability of the indicators, and in order not to fall into the trap of false regression and obtain logical results that correspond to the economic reality, the indicators were subjected to two tests, the first: the Augmented Dickey Fuller test (ADF Test), and the second, the Phillips–Perron test, which specializes in non-parametric tests. It is often used with small samples, and the test results were as follows:
Table (2) Results of the Augmented Dickey Fuller test (ADF Test), and the Phillips–Perron tests
|
UNIT ROOT TEST TABLE (PP)
| |||||
|
At Level
| |||||
|
A
|
B
|
C01
|
D01
| ||
|
With Constant
|
t-Statistic
|
-1.2064
|
2.6118
|
-1.9283
|
-1.3981
|
|
Prob.
|
0.6632
|
1
|
0.3167
|
0.5745
| |
|
n0
|
n0
|
n0
|
n0
| ||
|
With Constant & Trend
|
t-Statistic
|
-1.8653
|
-0.1005
|
-1.98
|
-1.8028
|
|
Prob.
|
0.655
|
0.9933
|
0.5954
|
0.686
| |
|
n0
|
n0
|
n0
|
n0
| ||
|
Without Constant & Trend
|
t-Statistic
|
-0.616
|
3.5553
|
-0.2183
|
0.2849
|
|
Prob.
|
0.4447
|
0.9998
|
0.6018
|
0.7639
| |
|
n0
|
n0
|
n0
|
n0
| ||
|
At First Difference
| |||||
|
d(A)
|
d(B)
|
d(C01)
|
d(D01)
| ||
|
With Constant
|
t-Statistic
|
-3.0541
|
-2.8499
|
-2.5847
|
-3.8187
|
|
Prob.
|
0.038
|
0.06
|
0.1041
|
0.0055
| |
|
**
|
*
|
n0
|
***
| ||
|
With Constant & Trend
|
t-Statistic
|
-3.0464
|
-3.9573
|
-2.6178
|
-3.8002
|
|
Prob.
|
0.1323
|
0.018
|
0.2749
|
0.0264
| |
|
n0
|
**
|
n0
|
**
| ||
|
Without Constant & Trend
|
t-Statistic
|
-3.0673
|
-2.2596
|
-2.6428
|
-3.7508
|
|
Prob.
|
0.003
|
0.0246
|
0.0095
|
0.0004
| |
|
***
|
**
|
***
|
***
| ||
|
UNIT ROOT TEST TABLE (ADF)
| |||||
|
At Level
| |||||
|
A
|
B
|
C01
|
D01
| ||
|
With Constant
|
t-Statistic
|
-1.6517
|
1.8583
|
-3.2253
|
-2.5336
|
|
Prob.
|
0.4479
|
0.9997
|
0.0256
|
0.1158
| |
|
n0
|
n0
|
**
|
n0
| ||
|
With Constant & Trend
|
t-Statistic
|
-2.8361
|
0.3989
|
-3.2309
|
-1.9503
|
|
Prob.
|
0.1933
|
0.9985
|
0.0927
|
0.6088
| |
|
n0
|
n0
|
*
|
n0
| ||
|
Without Constant & Trend
|
t-Statistic
|
-0.6065
|
2.1428
|
-0.7063
|
0.6321
|
|
Prob.
|
0.4487
|
0.9911
|
0.4048
|
0.8485
| |
|
n0
|
n0
|
n0
|
n0
| ||
|
At First Difference
| |||||
|
d(A)
|
d(B)
|
d(C01)
|
d(D01)
| ||
|
With Constant
|
t-Statistic
|
-2.941
|
-1.1634
|
-2.3572
|
-2.887
|
|
Prob.
|
0.0491
|
0.6801
|
0.1597
|
0.0563
| |
|
**
|
n0
|
n0
|
*
| ||
|
With Constant & Trend
|
t-Statistic
|
-2.9256
|
-5.8055
|
-2.4462
|
-5.0714
|
|
Prob.
|
0.1652
|
0.0001
|
0.3519
|
0.001
| |
|
n0
|
***
|
n0
|
***
| ||
|
Without Constant & Trend
|
t-Statistic
|
-2.9575
|
-0.4299
|
-2.4203
|
-2.5926
|
|
Prob.
|
0.0041
|
0.5212
|
0.0167
|
0.0109
| |
|
***
|
n0
|
**
|
**
| ||
|
Notes: (*)Significant at the 10%;
(**)Significant at the 5%; (***) Significant at the 1%. and (no) Not Significant
| |||||
Through the above table, it is noted that the indicators are a mixture of stability between the level and the first difference for all the studied indicators, but most of the stability tends to be still in the first difference and at the levels 1% and 5% for the Phelps-Peron test for all indicators alike, as is the case with the Dickey test Fuller developed as dormancy levels ranged between 1% and 5%.
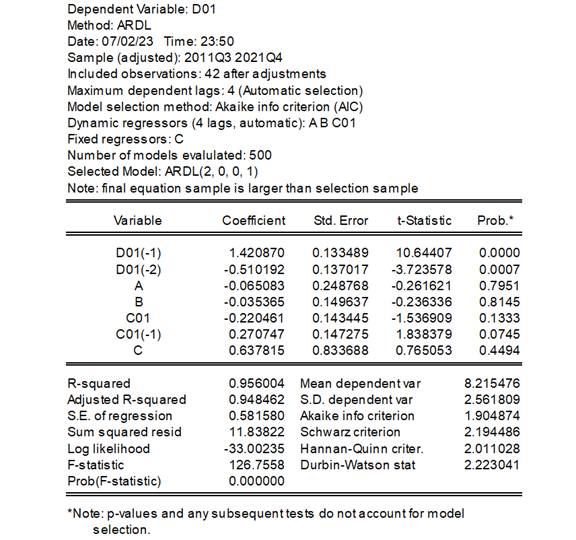
2- Choose the appropriate model:
The ARDL methodology test [1, ] shows through the table below that the appropriate model is (1, 0, 0, 2), that is, with ( one lags) for the bank default variable, which is an internal variable, and it was without lags (zero lags ) for each of the variables of banking spread and electronic payment services with (tow lags) for the banking depth variable, as shown below:
Table (3) Autoregressive methodology for the model ARDL
Source: Prepared by researchers based on the output of the statistical program Eviews 12.0
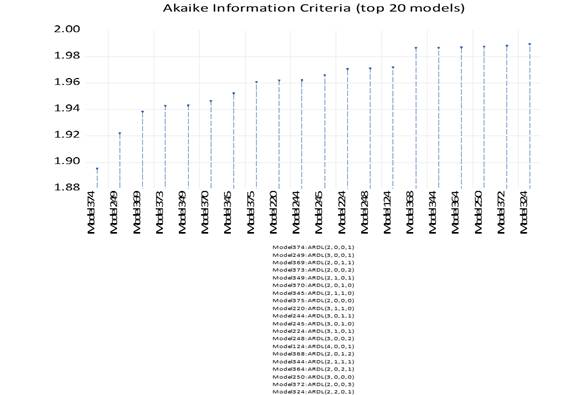
3- The Akaike information criterion test (AIC):
It is clear from the Akaike (AIC) test [15, ] below that the best model that was chosen through a comparison between 20 proposed models because it has statistical power in terms of the value of the Akaike standard (AIC), which represents the lowest value among the 20 selected models, is the model with number 374 ARDL (1 0 0 2) and as below:
Chart (1) The Akaike information criterion test
Source: Prepared by researchers based on the output of the statistical program Eviews 12.0
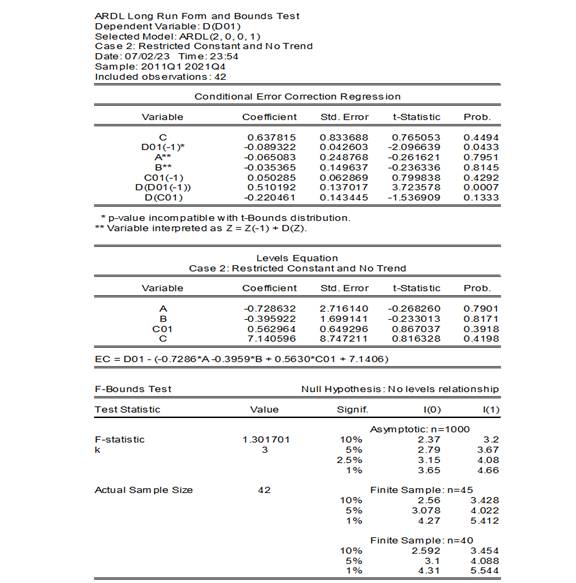
4- Bounds Test
The Bounds Test [14,] shows that there is no long-term relationship, or even a medium-term one, because the banking variables are in continuous development and it is possible to add many new variables that have a great impact on bringing about fundamental changes in the banking world or the banking environment, and we can attribute this to the decrease in the value of F calculated Which amounts to 1.30 and is less than the minimum limits at all tested levels. Accordingly, it can be judged that there is no long-term and medium-term equilibrium integration relationship between the studied variables, despite the estimated model passing all the post-test, which proves that it has passed the necessary statistical tests for the integrity of the model, as in the table below:
Table (4) Bounds Test
Source: Prepared by researchers based on the output of the statistical program Eviews 12.0
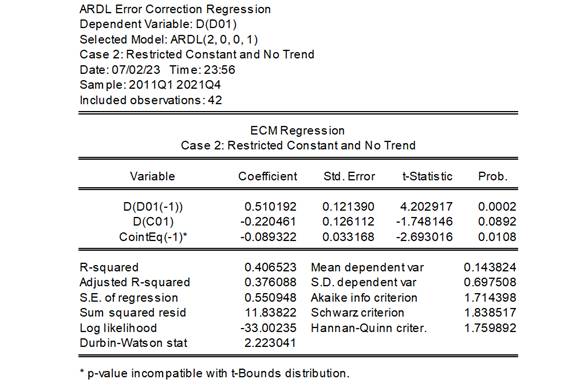
Sequentially for the post-standard tests [13, ], and for the integration equation parameter test, which must be negative and significant at the same time, which amounted to (-0.089322) with a probability of 5% amounting to (0.0108), as in the following table:
Table (5) error correction regression
Source: Prepared by researchers based on the output of the statistical program Eviews 12.0
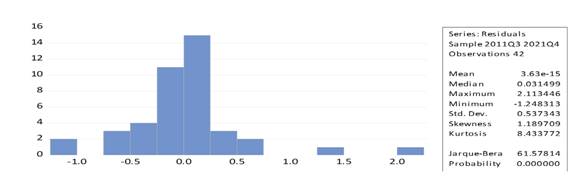
3- Normal distribution test [16,]:
The normal distribution test (Jarque - Bera) under the level of significance of 1% shows that the residuals of the estimated model are distributed in the form of a bell, and thus it can be said that the estimated model passed the test successfully, as in the following chart:
Chart (2) The normal distribution test (Jarque - Bera)
Source: Prepared by researchers based on the output of the statistical program Eviews 12.0
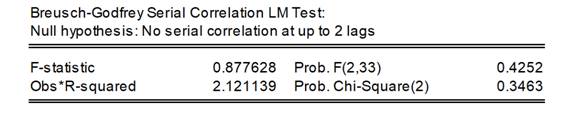
5- The serial correlation test LM [2,]:
Through the following table, which shows the serial correlation test of the residuals (2), that the estimated model does not suffer from this problem, since the probability of the F test (0.4252), as well as the case with the Chi-Square test (0.3463), is greater than the level of significance of 5%, as shown below:
Table (6) the serial correlation test of the residuals LM
Source: Prepared by researchers based on the output of the statistical program Eviews 12.0
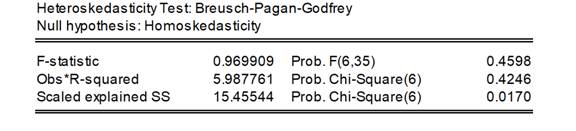
6- The heteroskedticity test :
It is clear from the heteroskedticity test [4, ] that the estimated model does not suffer from this statistical problem because the probability of F and Chi-Square is greater than the 5% level of significance, as shown below:
Table (7) the heteroskedticity test
Source: Prepared by researchers based on the output of the statistical program Eviews 12.0
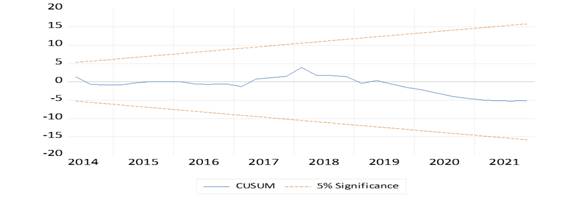
6- The CUSUM and CUSUM squares test [11, ]:
It is clear from the two tests below that the model does not suffer from the problem of deviating from the path of the phenomenon, although, as we mentioned before [12. ], there is no long-term equilibrium relationship between the variables studied, but the path of the phenomenon continued within the critical limits of the path of the phenomenon in both tests (2) and as in the following two charts:
Chart (3) CUSUM test
Source: Prepared by researchers based on the output of the statistical program Eviews 12.0
Chart (4) CUSUM of squares test
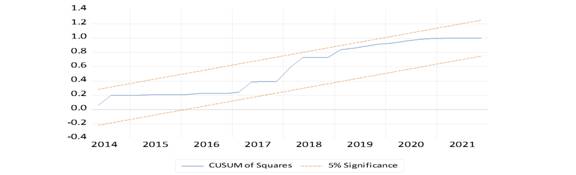
Source: Prepared by researchers based on the output of the statistical program Eviews 12.0
Conclusions:
1. The data has been converted to quarterly or quarterly in order to increase the size of the study sample, and this is what reinforces or gives us realistic or close to the truth results, since short time series cannot be subjected to aspects of standard analysis and result in false regressions and equilibrium relationships.
2. Stability tests were conducted for the aforementioned time series using two static tests, which are the Augmented Dickey Fuller test (ADF Test), and the Phillips–Perron tests. These two tests resulted in different levels of stability, ranging from the first level to the difference.
3. The variation in the levels of inactivity that ranges between the level and the first difference requires that we use the ARDL co-integration methodology, and that the appropriate model for the nature of the data is (1 0 0 2), that is, )one lags) of the bank default variable, which is considered the dependent variable or the internal variable and (zero lags) each Among the variables of banking prevalence and electronic payment services, with (two lags) for banking depth, these lags were chosen according to statistical and standard criteria, the most important of which is The Akaike information criterion test , and the significance of the model as a whole is proven according to F-STAT.
4. The bounds test indicated that there is no long or medium-term equilibrium complementary relationship between the studied variables, although the model passed all post-tests and standard statistical tests.
5. The output of the program proved that the coefficient of the error correction regression coefficient parameter is significant and negative at the same time, and this gives strength to the estimated model.
6. The outputs of the EVIEWS 12.0 statistical program proved that the estimated model passed the LM serial correlation test, being greater than the 5% level of significance.
Recommendations:
1- All banks need to adhere to the instructions and directives of the Central Bank.
2- It is imperative to follow up on the loan granted to any party, and in any sector it was invested in, as well as verifying the borrower's financial information.
3- The need to keep pace with the technological and informational development in terms of granting loans and methods of repayment.
4- Reducing the granting of loans to sectors or institutions that are not economically productive.
5- Activating the oversight aspect and the legislative and legal cover.
6- Going towards adopting stimulus and polarization policies for banks with low rates of bank failure, and neutralizing banks with high rates.
Источники:
2. Baltagi Badi H., Li Qi A joint test for serial correlation and random individual effects // Statistics & Probability Letters. – 1991. – № 11(3). – p. 277-280.
3. In Choi, Bhum Suk Chung Sampling frequency and the power of tests for a unit root: A simulation study // Economics Letters. – 1995. – № 49(2). – p. 131-136.
4. Dufour Jean-Marie, Khalaf Lynda, Bernard Jean-Thomas, Genest Ian Simulation-based finite-sample tests for heteroskedasticity and ARCH effects // Journal of Econometrics. – 2004. – № 122(2). – p. 317-347.
5. Franke Todd, Ho, Timothy, Christie Christina The Chi-Square Test Often Used and More Often Misinterpreted // American Journal of Evaluation. – 2012. – № 33. – p. 448-458. – doi: 10.1177/1098214011426594.
6. George J. Benston, George G. Kaufman Risks and Failures in Banking; Overview, History, and Evaluation. - Federal Reserve Bank of st. Louis, 2010. – 28 p.
7. Halunga Andreea G., Orme Chris D., Yamagata Takashi A heteroskedasticity robust Breusch–Pagan test for Contemporaneous correlation in dynamic panel data models // Journal of econometrics. – 2017. – № 198(2). – doi: 10.1016/j.jeconom.2016.12.005.
8. Jeong Jinook, Kim Tae-Hwan, Hyun Joo-Yeon, Mun Hyeong The effect of a variance shift on the Breusch-Godfrey's LM test // Applied Economics Letters. – 2010. – № 17. – p. 399-404. – doi: 10.1080/13504850701748933.
9. Khan A.D. Theralationship between Liquidity riskk and credit facilities and its impact on the profitablity // Commercial banks in India. – 2019. – № 3.
10. Kirti Solanki Financil services, Definition, Objectives. - CMFS, 2022.
11. Lee Sangyeol, Park, Siyun The Cusum of Squares Test for Scale Changes in Infinite Order Moving Average Processes // Scandinavian Journal of Statistics. – 2001. – № 28. – p. 625-644. – doi: 10.1111/1467-9469.00259.
12. Leybourne Stephen, Taylor Robert, Kim Tae-Hwan CUSUM of squares-based tests for a change in persistence // Journal of Time Series Analysis. – 2007. – № 28(3). – p. 408-433. – doi: 10.1111/j.1467-9892.2006.00517.x.
13. Nkoro E., Uko A. K. Autoregressive Distributed Lag (ARDL) Cointegration Technique: Application and Interpretation // Journal of Statistical and Econometric Methods. – 2016. – № 5. – p. 63-91.
14. Pesaran M. Hashem, Shin, Yongcheol, Smith Richard J. Bounds testing approaches to the analysis of level relationships // Journal of applied econometrics. – 2001. – № 16(3). – p. 289-326. – doi: 10.1002/jae.616.
15. Sakamoto Y., Ishiguro M., Kitagawa G. Akaike information criterion statistics. - Kluwer Academic Publishers Group, Dordrecht, Netherlands, 1986. – 290 p.
16. Thadewald T., Büning H. Jarque–Bera test and its competitors for testing normality–a power comparison // Journal of applied statistics. – 2007.
Страница обновлена: 16.07.2026 в 18:32:55
Download PDF | Downloads: 48
Измерение взаимосвязи влияния некоторых показателей финансовых услуг на банкротство банков в Ираке в 2011-2021
Ghaleb Shaker B., Adel Salam K., Falah Thamer A.Journal paper
Journal of International Economic Affairs
Volume 13, Number 4 (October-December 2023)
Abstract:
Цель статьи - проанализировать взаимосвязь между некоторыми показателями финансовых услуг, их уровнем качества и банкротством банков. Авторы статьи рассматривают вопрос о том, как улучшение этих услуг позволяет избежать рисков и кризисов в банковском секторе, в частности, банкротства заемщиков или их неспособности выплачивать свои финансовые обязательства, что оказывает влияние на эффективность банковской системы и бесперебойность банковских услуг, предоставляемых клиентам. Для анализа стандартной взаимосвязи и ее экономической интерпретации была использована методология ARDL. Результаты стандартных тестов показали, что подходящей моделью является модель (1, 0, 0, 2), в которой учитываются следующие переменные: внутренняя переменная банковского дефолта (один период замедления), переменные банковского спреда и услуг электронных платежей (без периодов замедления), д переменная качества и объема банковского обслуживания (два периода замедления).
Keywords: финансовые услуги, банкротство банка, услуги электронных платежей
JEL-classification: F34, F38, G21
References:
Bahmani-Oskooee Mohsen, Raymond Chi Wing Ng (2002). Long-run demand for money in Hong Kong: an application of the ARDL model International journal of business and economics. (1(2)). 147-155.
Baltagi Badi H., Li Qi (1991). A joint test for serial correlation and random individual effects Statistics & Probability Letters. (11(3)). 277-280.
Dufour Jean-Marie, Khalaf Lynda, Bernard Jean-Thomas, Genest Ian (2004). Simulation-based finite-sample tests for heteroskedasticity and ARCH effects Journal of Econometrics. (122(2)). 317-347.
Franke Todd, Ho, Timothy, Christie Christina (2012). The Chi-Square Test Often Used and More Often Misinterpreted American Journal of Evaluation. (33). 448-458. doi: 10.1177/1098214011426594.
George J. Benston, George G. Kaufman (2010). Risks and Failures in Banking; Overview, History, and Evaluation
Halunga Andreea G., Orme Chris D., Yamagata Takashi (2017). A heteroskedasticity robust Breusch–Pagan test for Contemporaneous correlation in dynamic panel data models Journal of econometrics. (198(2)). doi: 10.1016/j.jeconom.2016.12.005.
In Choi, Bhum Suk Chung (1995). Sampling frequency and the power of tests for a unit root: A simulation study Economics Letters. (49(2)). 131-136.
Jeong Jinook, Kim Tae-Hwan, Hyun Joo-Yeon, Mun Hyeong (2010). The effect of a variance shift on the Breusch-Godfrey's LM test Applied Economics Letters. (17). 399-404. doi: 10.1080/13504850701748933.
Khan A.D. (2019). Theralationship between Liquidity riskk and credit facilities and its impact on the profitablity Commercial banks in India. (3).
Kirti Solanki (2022). Financil services, Definition, Objectives
Lee Sangyeol, Park, Siyun (2001). The Cusum of Squares Test for Scale Changes in Infinite Order Moving Average Processes Scandinavian Journal of Statistics. (28). 625-644. doi: 10.1111/1467-9469.00259.
Leybourne Stephen, Taylor Robert, Kim Tae-Hwan (2007). CUSUM of squares-based tests for a change in persistence Journal of Time Series Analysis. (28(3)). 408-433. doi: 10.1111/j.1467-9892.2006.00517.x.
Nkoro E., Uko A. K. (2016). Autoregressive Distributed Lag (ARDL) Cointegration Technique: Application and Interpretation Journal of Statistical and Econometric Methods. (5). 63-91.
Pesaran M. Hashem, Shin, Yongcheol, Smith Richard J. (2001). Bounds testing approaches to the analysis of level relationships Journal of applied econometrics. (16(3)). 289-326. doi: 10.1002/jae.616.
Sakamoto Y., Ishiguro M., Kitagawa G. (1986). Akaike information criterion statistics
Thadewald T., Büning H. (2007). Jarque–Bera test and its competitors for testing normality–a power comparison Journal of applied statistics.