Measuring the relationship between the exchange rate and the Iraqi trade balance for the period 2003–2018 using the cause of Granger
Hatem Kareem Balhawi1, Baydaa Jawad Kazem1, Zeina Khudhair Mahmoud1
1 Wasit University, College of Administration and Economic, ,
Скачать PDF | Загрузок: 120
Статья в журнале
Экономические отношения (РИНЦ, ВАК)
опубликовать статью | оформить подписку
Том 10, Номер 4 (Октябрь-декабрь 2020)
Эта статья проиндексирована РИНЦ, см. https://elibrary.ru/item.asp?id=44491640
Аннотация:
The Iraqi economy has suffered from structural imbalances since 1980 due to the wars it fought, which negatively affected its economic reality and led to deterioration in the exchange rate, which affected the balance of trade. The research is based on the premise that there is a reciprocal relationship between the exchange rate and the Iraqi trade balance. The importance of the research also comes from the fact that the subject of the study is concerned with measuring external indicators that measure international competitiveness. The research is primarily aimed at verifying the validity of the hypothesis. The descriptive analytical approach was based on quantitative analysis to measure the relationship between the exchange rate and the Iraqi trade balance using the Eviews program.
Ключевые слова: exchange rate, trade balance, economic diversification, monetary policy
JEL-классификация: F44, O24, O53
Introduction
The exchange rate is an important economic variable, because it has an important role in the economies of countries, no economy is living independently of being affected by changes in the currency exchange market [1, p. 105–138] (Drobot, Losinkova, Pospelova, Utyabaeva, Fedash, 2018, p. 105–138). The exchange rate is also a mirror that reflects the state's trade position with the outside world through the relationship between exports and imports, and through the exchange rate can link the domestic economy to foreign economies.
The Iraqi economy has suffered from severe crises that have led to major imbalances in the overall balances resulting from the wars it has fought. Since the early 1990s, its economy has been subjected to waves of hyperinflation, as a result of internal and external shocks, coupled with the injection of a huge monetary mass to trade the economy [2, p. 693–704] (Al-Fakhad, 2019, p. 693–704).
As for the Iraqi trade balance, it was no better than the exchange rate of the dinar, particularly the period (1990–1996), in which the trade balance was negative, because of the wars fought by Iraq at the time, as well as the embargo imposed on the Iraqi economy, which had a significant impact on Iraqi exports and imports, which were almost halted, as the decline in oil exports played a major role in the deterioration of the Iraqi trade balance [3, p. 2349–2366] (Zvyagintsev, 2019, p. 2349–2366), especially since these exports represent the bulk of the trade balance, which represents a greater proportion of the trade balance: about 95% of total Iraqi exports against the decline of exports from other sectors [4, p. 63–72] (Kalakaeva, Mrikaev, 2018, p. 63–72).
Research problem
The Iraqi economy is suffering from structural imbalances that have led to the deterioration of some indicators of the Iraqi economy, including the exchange rate, which has affected the balance of trade.
The importance of research
The importance of the research comes from the fact that the subject of the study is concerned with measuring the relationship between the exchange rate and the trade balance, which is one of the external indicators that measure the extent of international competitiveness and the importance of trade.
Research hypothesis
The research is based on the premise that there is a reciprocal relationship between the exchange rate and the Iraqi trade balance.
Search objectives
The main objective of the research is to verify the validity of the hypothesis as well as to achieve what comes:
1) Analysis of the reality of the exchange rate in the Iraqi economy.
2) Analysis of the Iraqi trade balance.
3) Measuring the reciprocal relationship between the exchange rate and the Iraqi trade balance.
Research methodology
The descriptive analytical approach was based on the collection and analysis of data on the Iraqi exchange rate and trade balance, and the quantitative approach was used based on the Granger methodology between the exchange rate and the Iraqi trade balance using the Eviews program.
The first topic: Analysis of the Iraqi exchange rate for the duration (2003-2018)
After 2003, the exchange rate fell by -1.07%; this volatility was often caused by the high monetary supply in the Iraqi economy and the general level of prices, and after the Central Bank of Iraq gained its independence in the operation of its instruments following the issuance of the Central Bank's 2004 law (56) which was considered a transitional phase in the history of the Iraqi banking system, because it issued instructions and orders on monetary and credit policy, and after the dinar exchange rate was the main objective of the Monetary Authority through its use, through its use, the dinar exchange rate represented the basis of the monetary authority through its use. An intermediate objective to control the inflationary pressures resulting from the destruction of the real aspect of the Iraqi economy, as a result of occupation and sabotage, as well as to cope with the increase in government expenditures [5, p. 17]. To meet the requirements for the reconstruction of what was destroyed by the occupation, Increasing salaries and operating levels, the first tool used by the Central Bank to address the inflation situation was the price instrument represented by the exchange rate of the local currency against foreign currency, on 4/10/2003 the Central Bank began to work with foreign exchange auctions to activate its monetary instruments, especially the operations of the open market, as well as to achieve the central bank's goal of improving the value of the Iraqi dinar and then maintaining the stability of this value, which was confirmed by its new law [6, p. 86] (Falah Hassan Karim, 2010, p. 86).
For 2003, the exchange rate 1,453 dinars per dollar compared to 1,936 dinars per dollar in 2003, then the exchange rate 1.76 dinars to the dollar in 2007, and the rate of improvement -14.1%. Between 2006 and 2007, the Central Bank's monetary policy strengthened and supported the exchange rate of the Iraqi dinar against the dollar, and reduced inflation in the Iraqi economy [7, p. 36] (Soraya Abdul Rahim, 2007, p. 36). Growth has moved forward, as well as stabilized the security situation, and then improved by -1.74%. In 2009, this improvement is due to the monetary policy adopted by the Central Bank by supporting the Iraqi dinar by selling the dollar at daily auctions, as well as by putting large amounts of foreign exchange on the domestic market [8, p. 153].
Table 1
Iraqi dinar exchange rate against US dollar for the duration (2003-2018) (JD/USD)
|
Year
|
Nominal price
|
Market Price
|
Market price growth rate,
% |
|
2003
|
1.896
|
1.936
|
-1.07
|
|
2004
|
1.453
|
1.453
|
-24.94
|
|
2005
|
1,469
|
1.472
|
1.3
|
|
2006
|
1.467
|
1.475
|
0.2
|
|
2007
|
1.255
|
1.267
|
-14.1
|
|
2008
|
1.172
|
1.203
|
-5.05
|
|
2009
|
1.170
|
1.182
|
-1.74
|
|
2010
|
1.170
|
1.186
|
0.33
|
|
2011
|
1.170
|
1.196
|
0.84
|
|
2012
|
1.166
|
1,233
|
3.09
|
|
2013
|
1,166
|
1.232
|
-0.08
|
|
2014
|
1.188
|
1.214
|
-1.5
|
|
2015
|
1.190
|
1.247
|
2.7
|
|
2016
|
1.190
|
1.275
|
2.25
|
|
2017
|
1.190
|
1.258
|
-1.33
|
|
2018
|
1.190
|
1,208.9
|
-3.9
|
Despite this improvement in the value of the dinar against the dollar, the exchange rate of the dinar against the dollar declined in 2012 to 1.233 dinars per dollar and a growth rate of 3.09 percent. In 2014, the Central Bank maintained the stability of the exchange rate against the dollar at its base price of 1.166 dinars per dollar since 2012, through the foreign exchange buying and selling window, while the Iraqi dinar's rate against the US dollar in the market has increased in value during this year. In 2017, the Central Bank continued to diversify its investments, particularly foreign ones, in order to support stability in the exchange rate, as the exchange rate of the dinar against the U.S. dollar maintained its value of 1,190 dinars per dollar [9, p. 30] (Falah Hussein Karim, 2010, p. 30).
In 2018, monetary policy succeeded in reducing the gap between the nominal and parallel exchange rates to 0.7% on average for 2018, after registering 4.8%. At the rate for 2017, as noted from table 1, this period (2003–2018) in which the discrepancy between the official exchange rate and the market price gradually decreased as the difference between the two prices became slight, as opposed to the period (1990–2002) in which the difference between the two prices was very large [10, p. 34] (Ali Salman Malallah, 2008, p. 34).
The second topic: Analysis of the trade balance structure for the duration (2003–2018(
Through table 2 we find that there was a slight decrease in the trade balance in 2003 to record a deficit of 1,944 million dollars, and that the reason for this decline is the result of the shift to an open market economy, while the percentages of both exports and imports recorded high negative growth (-40.92%, -39.7%). In 2003 compared to the previous year, the reason for the continuation of this deficit, which began to be evident as a result of the American occupation [11, p. 26] (Simaya Mohsen, Samira Fawzi, 2016, p. 26).
This occupation has caused many changes, including a rise in purchasing capacity, which has led to a rise in private demand, as well as a rise in current expenditures for the government budget, which amounted to 70%, and this has led to a rise in public demand, which shows us that the overall demand, which is represented by public and private demand, has also increased, causing an increase in imports as a result of the weakness of the Iraqi productive apparatus and its inability to meet the needs of high domestic demand as well as the change in the system and instability of security [12, p. 22].
However, it quickly generated a surplus during the subsequent periods, with the trade deficit rising from $1,464 million in 2004 to $30,838 million in 2008, but as a result of the global financial crisis, the rise in the trade balance was reduced as a result of changes in oil-exporting prices and reached $5,547 million in 2009, while total exports fell significantly to $39,427 million in 2009. A negative change rate of 38.13%, as well as imports, increased slightly and recorded 36,858 million dollars in 2009 [13, p. 76] (Adib Qasim Shendi, 2016, p. 76).
The rate of change was 12.07%. Subsequent periods in which the trade balance achieved a positive surplus as a result of the improvement in the situation in the country, rose to 37,938 million dollars in 2012, but this surplus decreased in 2015 to 4,397 million dollars, as a result of the decline in exports of the terrorist organization in 2014, as well as the decline in the average oil prices per barrel to 44.9 million dollars in 2015 compared to the price of 94.9 million in 2015 [14, p. 78] (Bida Jabbar Shoit, 2015).
The change rates for both exports and imports were 48.27%, -26.57%. For 2015, however, the trade balance increased in 2018 to $40,624 million, the highest value recorded by the trade balance during this period due to a rise in exports to record 80,360 million dollars due to the rise in the world oil price [15, p. 22].
Table 2
Iraqi trade balance structure for the duration (2003–2018) ($Billion)
|
Year
|
Total
exports
|
Percentage
change in exports
|
Total
imports
|
Import
change rate
|
Trade
balance
|
|
2003
|
7,990.000
|
-39.7
|
9,934.000
|
-40.92
|
-1,944.000
|
|
2005
|
23,697.000
|
28.16
|
23,532.000
|
17.93
|
165.000
|
|
2006
|
30,528.000
|
28.83
|
22,009.000
|
-6.47
|
8,519.000
|
|
2007
|
39,590.000
|
29.68
|
21,332.000
|
-3.07
|
18,258.000
|
|
2008
|
63,726.000
|
60.96
|
32,888.000
|
54.17
|
30,838.000
|
|
2009
|
39,427.000
|
-38.13
|
36,858.000
|
12.07
|
2,569.000
|
|
2010
|
51,764.000
|
31.23
|
39,275.000
|
6.55
|
12,489.000
|
|
2011
|
79,681.000
|
53.93
|
50,581.000
|
28.78
|
29,100.000
|
|
2012
|
94,172.000
|
18.19
|
56,234.000
|
11.17
|
37,938.000
|
|
2013
|
89,769.000
|
-4.68
|
58,796.000
|
4.55
|
30,973.000
|
|
2014
|
83,981.000
|
-6.45
|
53,177.000
|
-9.55
|
30,804.000
|
|
2015
|
43,442.000
|
-48.27
|
39,045.000
|
-26.57
|
4,397.000
|
|
2016
|
40,759.000
|
-6.18
|
34,280.000
|
-12.2
|
6,479.000
|
|
2017
|
57,559.000
|
41.22
|
38,766.000
|
13.1
|
18,793.000
|
|
2018
|
86,360.000
|
50
|
45,736.000
|
17.9
|
40,624.000
|
The third topic: The practical aspect of measuring the relationship between the exchange rate and the Iraqi trade balance for the duration (2003–2018)
1. Description of the model.
Through the theoretical and analytical aspect of the research and based on the logic of economic theory, sources and previous studies we obtained the required data concerning the independent variable (X) which the exchange rate in the market as well as the variable dependent (Y) which expresses the trade balance for the period (1990–2018) as described in table 3.
Table 3
Standard Model
|
Trade balance, million dollar
|
Exchange rate in the market,
JD/USD |
Year
|
Trade balance, million dollar
|
Exchange rate in the market,
JD/USD |
Year
|
|
8,519.000
|
1.472
|
2005
|
3,788.000
|
4
|
1990
|
|
18,258.000
|
1.475
|
2006
|
-0,000.46
|
10
|
1991
|
|
30,838.000
|
1.267
|
2007
|
-0,000.85
|
21
|
1992
|
|
2,569.000
|
1.203
|
2008
|
-0,000.76
|
74
|
1993
|
|
12,489.000
|
1.182
|
2009
|
-0,000.46
|
456
|
1994
|
|
29,100.000
|
1.186
|
2010
|
-0,000.169
|
1.674
|
1995
|
|
37,938.000
|
1.196
|
2011
|
-2,801.000
|
1.170
|
1996
|
|
30,973.000
|
1.233
|
2012
|
0,000.183
|
1.471
|
1997
|
|
30,804.000
|
1.232
|
2013
|
-0,000.483
|
1.620
|
1998
|
|
4,397.000
|
1.214
|
2014
|
2,150.000
|
1.972
|
1999
|
|
6,479.000
|
1.247
|
2015
|
7,170.000
|
1.930
|
2000
|
|
18,793.000
|
1.275
|
2016
|
2,678.000
|
1.929
|
2001
|
|
40,624.000
|
1.258
|
2017
|
-3,567.000
|
1.957
|
2002
|
|
8,519.000
|
1.208
|
2018
|
-1,944.000
|
1.936
|
2003
|
|
|
|
|
0,000.165
|
1.453
|
2004
|
2. Stability of time series
There are several ways to show the stability of time series and we will rely on three methods of graph method, the second unit root test (ADF) and the third test (KPSS, P.P).
2. We draw the variable series (X) exchange rate in the market as in Figure 1 it is clear that the series is stable because it revolves around its average.
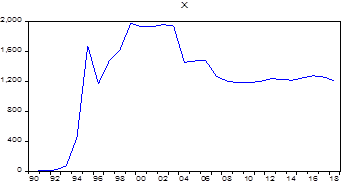
Figure 1. Time series chart for variable (x) at the original level
Source: From the work of the researcher based on eviews 9.
In order to ensure the instability of the time series, we test the root of the unit (ADF) as described in table 4, which is clear by comparing (t) scheduled (4.362506) as greater than (-2.991878) calculated below a moral level (0.05) as well as the value of p-valu of (0.05) and this means that we accept the assumption that the unit's rule is not stable.
Table 4
Dickie Fuller's x-level test
Source: From the work of the researcher based on eviews 9
It is also noted through Table 5 that the value of the kpss test is 0.213470 smaller than the critical value (Kwiatkowski) at a moral level (5%) This means that we accept the non-existent imposition that determines that there is no unit root, that the chain is stable.
Table 5
KPSS for variable (x) at the original level
Source: From the work of the researcher based on eviews 9.
It is also noted through table 4 that the value of the statistical test (PP) is -2.997919 greater than the critical value (Mackinnon) at a moral level 5%. -2.976263 is also less p-value than 0.05, which means that we accept the alternative hypothesis that determines that there is no unit root, the chain is stable.
Table 6
P.P test for variable (x) at the original level
Source: From the work of the researcher based on eviews 9.
3.We draw the series for the variable (Y) trade balance: as in the Figure 2 and it is clear that the series is unstable because it does not revolve around its average.
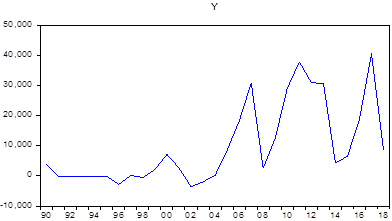
Figure 2. Time series chart for variable (y) at the original level
Source: From the work of the researcher based on eviews 9.
In order to ensure the instability of the time series, we test the root of the unit (ADF) as described in the table 7 shown by comparing (t) the scheduled -2.588691 as smaller than -2.971853 calculated under a moral level 0.05 as well as the value of p-value greater than 0.05; and this means that we accept the hypothesis of the non-existence of the unit root in the non-time series.
Table 7
Dickie Fuller's y-level test
Source: From the work of the researcher based on eviews 9.
It is also noted through table 8 that the value of the KPSS statistical test was 0.613542 greater than the critical value (Kwiatkowski) at a moral level 5%. This means that we accept the alternative hypothesis that determines the existence of the root of the unit, that the chain is unstable.
Table 8
KPSS for variable (y) at the original level
Source: From the work of the researcher based on eviews 9.
It is also noted through table 9 the value of the statistical test (PP) is -2.609769 smaller than the critical value (Mackinnon) at a moral level 5%. -2.971853 is also more than 0.05 and this means that we accept the hypothesis of a unit root, the chain is unstable.
Table 9
P.P test for variable (y) at the original level
Source: From the work of the researcher based on eviews 9.
In order to determine the stability of time series, we take the differences as follows:
4. We draw the series for variable (Y) trade balance: as in the Figure 3 and it is clear that the chain is stable at the second difference.
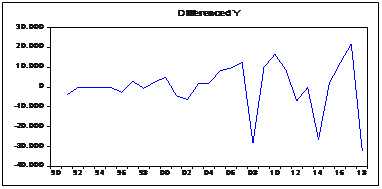
Figure 3. Time series drawing of variable (y) at the second difference
Source: From the work of the researcher based on eviews 9.
In order to ensure the instability of the time series, we test the root of the unit (ADF) as described in the table 10 illustrated by comparing (t) the scheduled -7.747335 as greater than -3.004861 calculated under a moral level 0.05 as well as the value (p-valu) of 0.05 and this means that we accept the hypothesis that the unit root is not stable in any time series.
Table 10
Dickie Fuller's variable (y) at the second difference
Source: From the work of the researcher based on eviews 9.
It is also noted through that the value of the KPSS statistical test was 0.258139 smaller than the critical value (Kwiatkowski) at a moral level 5%. This means that we accept the non-existent imposition that determines that there is no unit root, that the chain is stable.
Table 11
KPSS for variable (y) at the second difference
Source: From the work of the researcher based on eviews 9.
It is also noted through Table 12 that the value of the statistical test (PP) is -11.25658 greater than the critical value (Mackinnon) at a moral level 5%. -2.981038 is also less than 0.05; and it means that we accept the hypothesis that there is no unit root, i.e. the chain is stable.
Table 12
P.P test for variable (y) at the second difference
Source: From the work of the researcher based on eviews 9
Source: From the work of the researcher based on eviews 9.
We now have to determine the slowing periods according to the VAR model and as shown in the Table 13
Table 13
Determination of the slowing periods according to the VAR model
Based on the AIC standard, the optimal number of deceleration periods can be determined and in order to determine the optimal number of decelerations you choose the lowest value of the AIC standard and by Table 13 note that the lowest value was achieved at the first deceleration level.
We now come to estimate the VAR model for the variables studied, since the number of delays to be entered in the model is p=3 the complete model is VAR = P =3, and the results of the overall model estimation as in table 14
Economic explanation
- The value of the fixed value, which indicates that the value of the first difference of the fixed limit is 4,252.524 with the stability of the values of all variables of the model, which means that the balance of trade rises naturally, without being affected by any variable, especially the exchange rate.
- A positive and morally strong effect between the exchange rate and the trade balance means that an increase in the exchange rate by one unit leads to a trade balance of 3,459.2
Statistical explanation
- The selection coefficient equal to (R2=0.72) i.e. 72%, of the resulting volume changes in the balance of trade is explained by the exchange rate and the remaining (28%) explained by variables other than entered into the standard model included in the random variable u
- The F test also indicates the overall indication of the model: F-stat = 14.23095 is larger than the (F) table, which indicates that the overall model is statistically significant.
Table 14
Model (VAR) for standard model
Y = 4,252.524 + 33,459.2 X(-2
R2=0.72 F-Stat= 14.23095 n=27 Log likelihood= -188.0999
Conclusions
1) The validity of the hypothesis has been proven through the analytical and standard aspect as there is a positive relationship between exchange rates and the Iraqi trade balance.
2) The exchange rate of the Iraqi dinar after 2003 is improving, especially after the Central Bank of Iraq gained its independence in managing its instruments following the issuance of the 2004 Law No. 56 of the Central Bank, which engaged in foreign exchange auctions, to improve the value of the Iraqi dinar and then maintain the stability of this value, which was confirmed by its new law.
3) The variables studied in the standard model of the research apply to the logic of economic theory so that there is a positive and morally strong effect between the exchange rate and the trade balance, which means that the increase in the exchange rate by one unit leads to a trade balance of 3,459.2
Recommendations
1) It is necessary to pay attention to the exchange rate in a large way and give the monetary authority represented by the Central Bank greater autonomy in making the right decisions, which are in the interest of the national economy and the use of its effective instruments in maintaining the stability and stability of the exchange rate and making it trustworthy to citizens and investors.
2) It is required to take into account the reciprocal relationship between the exchange rate and the trade balance and this relationship is linked to the productive apparatus of the country and its flexibility when the exchange rate decreases domestic goods becomes cheaper than foreign goods, so they have competitiveness with foreign goods, the demand increases externally, i.e. increasing exports on imports, creating a surplus in the trade balance, but if the exchange rate increases on foreign goods, imports increase and exports decrease.
3) The Central Bank must maintain a fixed exchange rate for the Iraqi dinar, which is the responsibility of the Central Bank of Iraq, as it is necessary to independently and operate away from political influences and partisan bargaining, so the Central Bank should follow a higher body of macroeconomic policy plans to ensure that it does not violate its oath or move away from the general purpose, the independence of the Central Bank does not absolve it of public responsibility.
Источники:
2. Аль-Фахад А.З.М. Анализ туристического потенциала Ирака: сильные и слабые стороны // Экономические отношения. – 2019. – Том 9. – № 2. – С. 693-704. – doi: 10.18334/eo.9.2.40714.
3. Звягинцев А.И. О контроле хаотичной динамики на валютном рынке // Экономические отношения. – 2019. – Том 9. – № 3. – С. 2349-2366. – doi: 10.18334/eo.9.3.41137.
4. Калакаева К.З., Мрикаев Д.М Влияние санкций на финансовый рынок зарубежных стран на примере Ирана // Экономические отношения. – 2018. – Том 8. – № 1. – С. 63-72. – doi: 10.18334/eo.8.1.38734.
5. Annual Economic Report, Central Bank of Iraq, Department of Statistics and Research, Baghdad, 2018, p.17
6. Falah Hassan Karim, The Role of Monetary Policy in The Stability of the Exchange Rate in Iraq Standard Study for The Duration (1990-2008), Unpublished Master's Letter to the Faculty of Management and Economics, University of Baghdad, 2010, p.86
7. Soraya Abdul Rahim, Assessing the Performance of Monetary Policy in Iraq and Its Impact on Inflation, An Analytical Study of the Duration (1980-2003) Journal of Economic and Administrative Sciences, University of Baghdad, Volume 13, Issue 48, 2007, p.153.
8. Annual Economic Report, Central Bank of Iraq, Directorate General of Statistics and Research, Baghdad, 2014, p.30
9. Falah Hussein Karim - The Role of Monetary Policy in Exchange Rate Stability - Master's Thesis - Faculty of Management and Economics - University of Baghdad - 2010.p.34
10. Ali Salman Malallah - The role of the interest rate and the foreign exchange rate in the movement of international financial flows - Master's thesis - Faculty of Management and Economics - University of Baghdad - 2008.p. 26
11. Simaya Mohsen, Samira Fawzi - The relationship between the exchange rate of the Iraqi dinar and the trade balance for the period (1990-2010) - Al-Dananer Magazine - Issue 9 - 2016. P. 22
12. Central Bank of Iraq - Directorate General of Statistics and Research - Annual Statistical Bulletin.2016.
13. Adib Qasim Shendi. Measuring the reciprocal relationship between the presentation of cash and indicators of economic stability in Iraq for the duration (1980-2013) al-Kut Economics and Administrative Journal No. 21. 2016 . P. 21
14. Bida Jabbar Shoit. The role of foreign trade in economic development in Iraq after 2003. Master's thesis. School of Management and Economics. Al-Mustansiriyah University. 2015 . P66
15. Central Bank of Iraq. Directorate General of Statistics and Research. Annual Economic Report. 2015 p18
Страница обновлена: 14.07.2026 в 21:08:52
Download PDF | Downloads: 120
Measuring the relationship between the exchange rate and the Iraqi trade balance for the period 2003–2018 using the cause of Granger
Hatem K.B., Baydaa J.K., Zeina K.M.Journal paper
Journal of International Economic Affairs
Volume 10, Number 4 (October-December 2020)
Abstract:
The Iraqi economy has suffered from structural imbalances since 1980 due to the wars it fought, which negatively affected its economic reality and led to deterioration in the exchange rate, which affected the balance of trade. The research is based on the premise that there is a reciprocal relationship between the exchange rate and the Iraqi trade balance. The importance of the research also comes from the fact that the subject of the study is concerned with measuring external indicators that measure international competitiveness. The research is primarily aimed at verifying the validity of the hypothesis. The descriptive analytical approach was based on quantitative analysis to measure the relationship between the exchange rate and the Iraqi trade balance using the Eviews program.
Keywords: exchange rate, trade balance, economic diversification, monetary policy
JEL-classification: F44, O24, O53
References:
Annual Economic Report, Central Bank of Iraq, Department of Statistics and Research (2018).
Annual Economic Report, Central Bank of Iraq, Directorate General of Statistics and Research (2014).
Annual Economic Report (2015).
Annual Statistical Bulletin (2016).
Adib Qasim Shendi (2016). Measuring the reciprocal relationship between the presentation of cash and indicators of economic stability in Iraq for the duration (1980-2013) Al-Kut Economics and Administrative Journal. (21). 21.
Al-Fakhad A.Z.M. (2019). Analiz turisticheskogo potentsiala Iraka: silnye i slabye storony [Analysis of the tourism potential of Iraq: strengths and weaknesses]. Journal of International Economic Affairs. (2). 693-704. (in Russian). doi: 10.18334/eo.9.2.40714.
Ali Salman Malallah (2008). The role of the interest rate and the foreign exchange rate in the movement of international financial flows
Bida Jabbar Shoit (2015). The role of foreign trade in economic development in Iraq after 2003
Drobot E.V., Losinkova V.A., Pospelova A.L., Utyabaeva E.R., Fedash K.A. (2018). Obzor klyuchevyh podkhodov k klassifikatsii stran mira i sravnitelnyy analiz osnovnyh makroekonomicheskikh pokazateley vedushchikh mirovyh ekonomik [Review of key approaches to the classification of the countries of the world and a comparative analysis of the main macroeconomic indicators of the world''s leading economies]. Journal of International Economic Affairs. (2). 105-138. (in Russian). doi: 10.18334/eo.8.2.39014.
Falah Hassan Karim (2010). The Role of Monetary Policy in the Stability of the Exchange Rate in Iraq Standard Study for The Duration (1990-2008)
Falah Hussein Karim (2010). The Role of Monetary Policy in Exchange Rate Stability
Kalakaeva K.Z., Mrikaev D.M. (2018). Vliyanie sanktsiy na finansovyy rynok zarubezhnyh stran na primere Irana [Impact of sanctions on the financial market of foreign countries by the example of Iran]. Journal of International Economic Affairs. (1). 63-72. (in Russian). doi: 10.18334/eo.8.1.38734.
Simaya Mohsen, Samira Fawzi (2016). The relationship between the exchange rate of the Iraqi dinar and the trade balance for the period (1990-2010) Al-Dananer Magazine. (9). 22.
Soraya Abdul Rahim (2007). Assessing the Performance of Monetary Policy in Iraq and Its Impact on Inflation, An Analytical Study of the Duration (1980-2003) Journal of Economic and Administrative Sciences, University of Baghdad. (48). 153.
Zvyagintsev A.I. (2019). O kontrole khaotichnoy dinamiki na valyutnom rynke [On controlling chaotic dynamics in the foreign exchange market]. Journal of International Economic Affairs. (3). 2349-2366. (in Russian). doi: 10.18334/eo.9.3.41137.