The Impact of Air Transportation on Regional Economic Growth, the Case of Uzbekistan
Скачать PDF | Загрузок: 46
Статья в журнале
Экономика Центральной Азии (РИНЦ, ВАК)
опубликовать статью | оформить подписку
Том 9, Номер 2 (Апрель-июнь 2025)
Эта статья проиндексирована РИНЦ, см. https://elibrary.ru/item.asp?id=82747742
Аннотация:
Цель -Целью данного исследования является количественная оценка влияния авиации на региональную экономическую эффективность, поскольку общие затраты на строительство и эксплуатацию инфраструктуры воздушного транспорта высоки, но заинтересованные стороны должны принимать важные и экономически обоснованные решения для определения приоритетов инвестиций в транспортную инфраструктуру с использованием количественного подхода на основе анализа.
Дизайн/Методология/Подход- В этом исследовании предлагается использовать тест причинности Грейнджера для панельных данных, поскольку он не только является хорошим индикатором причинно-следственной связи между переменными за определенный период времени, но также количественно показывает направление и скорость вклада, что позволяет лицам, принимающим решения, классифицировать инвестиционные приоритеты, особенно когда речь идет об инвестициях в транспортный сектор в развивающихся странах.
Выводы – Результаты анализа показывают, что существует долгосрочная связь между авиацией и региональными экономиками, где авиация может способствовать экономическому росту в долгосрочной перспективе. В частности, было подтверждено, что воздушное пассажирское движение оказывает более положительное влияние на экономику в туристических местах, в то время как авиаперевозки грузов в аэропортах-хабах могут привести к экономическим положительным изменениям в долгосрочной перспективе в 6 регионах Узбекистана, а именно в Ташкенте, Бухаре, Самарканде, Навои и Фергане. Это обычная картина, которую все развитые страны пережили в прошлом, что может естественным образом означать, что экономика Узбекистана вместе с авиацией следует естественной модели экономического и инфраструктурного роста с приемлемыми теневыми или искусственными вмешательствами.
Оригинальность/Ценность — этот вид исследований является традиционным в экономике транспорта в развитых странах в прошлом, тогда как в развивающихся странах, таких как Узбекистан, подобные исследования ранее не проводились.
Ключевые слова: причинность по Грейнджеру, панельные данные, авиация, региональная экономика, инвестиции в транспорт
JEL-классификация: L62, L91, L93
1. Introduction
The aviation sector plays a pivotal role in shaping regional economic dynamics, particularly in countries undergoing rapid development. In the case of Uzbekistan, a country strategically located in Central Asia, the growth of aviation infrastructure is poised to influence regional economic efficiency significantly. When we look through both economy of Uzbekistan and its export and import characteristics, we can point out that Uzbek Economy is half agricultural and half industrialized. Thus, Exports of Uzbekistan are low value-high volume manufactured products, Natural Resources (such as oil and gas) and Agricultural Products, Imports of Uzbekistan are mainly high valued technologies and equipment for further economic development and to boost industrialization. Consequently, mode choice is made according to value of the goods, the importance of the cargo and supply chain cycles. That is why, main modes of transport are pipeline, road and rail accordingly for both export and import, while the role of air is irreplaceable with exporting perishable products for the far distances with less lead time and importing high valued products for different kind of economic purposes. In Figure 1, it can be seen, main Trade flows, both Export and Import by sectors and by country.
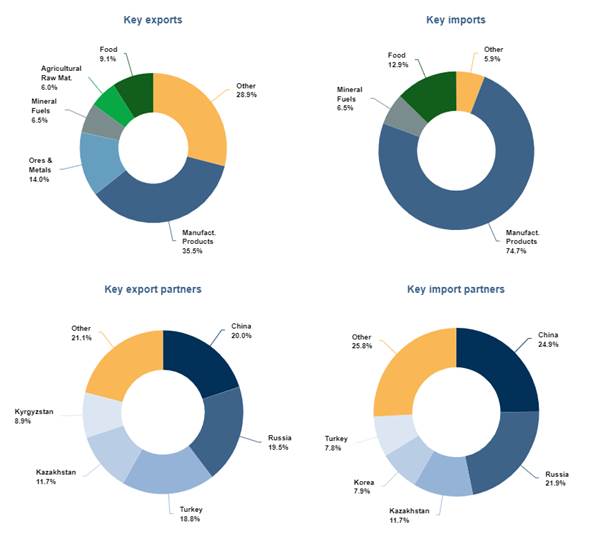
Figure 1. Key Exports and Imports of Uzbekistan by product sectors and country (The Statistics Committee of Republic of Uzbekistan)
This article examines how advancements in aviation affect the regional economic landscape in the case of Uzbekistan, offering insights into the broader implications for economic policy and regional development strategies for developing countries according to specific characteristics of each region. This Article’s research scope is 6 regions of Uzbekistan where are 6 international airports located, for purpose to measuring the impact of aviation on regional economic growth. Panel data analysis of Granger causality is used to find some hidden insights for concluding final results and implications.
2. Literature Review
2.1 The Background of Uzbekistan`s aviation and economy
Since we have been discussing Air Transport Sector in Uzbekistan, it was decided to divide Literature Review into 3 parts related to each other by developing research scenario. In particular, since we consider aviation industry in Uzbekistan, it was wise to conduct some literature review on current economic situation and air transport sector in Uzbekistan. According to Research provided by Khasan Babadjanov, Alisher Egamov (2021), Aviation Industry in Uzbekistan took place in early 1930s when first flight occurred from Tashkent to Moscow (the former capital of Soviet Union), consequently during World War II, In Uzbekistan, had been built several airports and aircraft manufacturing factory in Tashkent and various air lines routes had been formulated to different destinations in Soviet Union. Since Uzbekistan got independence from Soviet Union in early 1990s, with the order of the first President of Republic of Uzbekistan, first Uzbek Airlines Joint Stock Company established and took operations of 12 airports of Uzbekistan along with its aircrafts. (Uzbekistan Airways JSC,2024) Currently Uzbekistan has its own Airways and airline routes operating in several destinations of the World including, America, Europe, China, Korea and different Asian Countries. Considering Economic Developments, as we informed earlier, the economy of Uzbekistan is converting economy from agricultural into industrial one with average 6 % growth of GDP in each year (2023), with population growing 1 million people per year, vastly exporting low value-high volume goods, oil, gas, gold and agricultural products while importing different kind of equipment and technologies for enhancement of domestic manufacturing. (Asia Development Bank, 2024)
2.2 Granger Causality Models for Aviation Impact on Economies
In this research, main purpose is to quantify the effect of aviation on economic growth or vice versa and accordingly review has been conducted to identify the methodology and finding some research gaps in existing researches. Thus, the research conducted by Baker D, Merkert R, Kamruzzaman M (2015), on regional economic growth and cointegration and causality in the case of Australia, the both short and long run dynamics have been identified using Granger Causality Test. According to another research conducted, by Hakim, M.M. and Merkert, R. (2016), on the Causal Relationship of Air Transport and economic Growth in the case of South East Asia using Granger Causality, depicts that there is a positive long run relationship between variables. Continuously, According to T. Tong, T. Edward (2018), there is a long run causal relationship between Transportation and Economy in the case of China with the method used panel causality analysis. In a nutshell, Granger causality has been accepted as one good fit for this kind of researches.
Additionally, Literatures have been reviewed on methodology and below 2 citations made for reference as important after decision to use Granger Causality for Panel Data. According to Joudis A., Y Karavias., V.Sarafidis (2021), A homogeneous approach to testing for Granger non-causality in heterogeneous panels, it was found out that the resulting approach is valid irrespective of whether the alternative hypothesis is homogeneous or heterogeneous, or whether the autoregressive parameters vary across individuals or not, so long as T is (at least moderately) large. Furthermore, according to F.Zhang, Daniel J. Graham (2020), on topic: Air transport and economic growth: a review of the impact mechanism and causal relationships, it was stated that relationship between economic growth and air transport is bi-directional in less developed countries and causal effects between air transport and the economy can arise both through supply chain and spillover effects.
2.3 Contribution of this paper.
No this kind of research has been conducted in Central Asian Countries including Uzbekistan, so that this paper can be starting point for various research openings for Central Asian Economies in the future. This kind of research may contribute to the future of researches in Transport Economics and Policy.
3. Granger Causality Test for Panel Data
Panel datasets comprised of many individuals and many time periods are becoming widely available. A particularly salient case is the growing availability of cross-country data over time. As a consequence, the focus of panel data econometrics is shifting from micro panel, with large N and small T, to macro panels, where both N and T are large. In this setting, classical issues of timeseries econometrics, such as (non-)stationarity and (non-)causality, also arise. (Luciano Lopez, Sylvian Weber, 2017.)
Predictive (Granger) causality and feedback is an important aspect of applied time-series and longitudinal panel-data analysis. Dr. Granger (1969) developed a statistical concept of causality between two or more time-series variables, according to which a variable X “Granger-causes” a variable Y if the variable Y can be better predicted using past values of both X and Y rather than using solely past values of Y. The concept of “Granger causality” has been widely adopted in economics, medicine, chemistry, physics, biology, engineering, and beyond. (Jiaqi Xiao, Arturas Juodis, 2023.)
The formula for Granger Causality model for Panel Data as below.
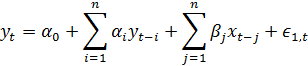
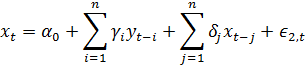
Equation 1. Granger Causality for Panel Data. (Luciano Lopez, Sylvian Weber, 2017.)
But, when we are checking relationship of variables through Granger Causality, we need to take into consideration the issue of stationarity of the variables for further continue of analysis. The first generation of tests includes Levin, Lin and Chu’s test (2002), Im, Pesaran and Shin (2003) and the Fisher-type test proposed first by Maddala and Wu (1999), then developed by Choi (2001). The main limitations of these tests are that they are all constructed under the assumption that the individual time series in the panel are cross-sectionally independently distributed, when on the contrary a large amount of literature provides evidence of he co-movements between economic variables. The Panel Unit Root Tests allow to investigate mean-revision in the group of series. Levin-Lin-Chu Test was built on the base of Dickey Fuller (or Augmented Dickey Fuller (ADF)) Test. The baseline framework is the ADF regression for panel data as below:

• Where ![]() -1
-1
• The typical null hypothesis for testing non-stationarity
![]() =1)
=1)
• The Alternative hypothesis is not common for the panel unit root test that based on the ADG regression:
![]() =
= ![]() 1) for all panels
1) for all panels
![]() 1) for some panels
1) for some panels
Equation 2. Panel Unit Root Test. (Levin, Lin and Chu, 2002.)
Once
we found out that our data is stationary, we are good to run Cointegration Test
to check for Cointegrating vectors. Pedroni (1999, 2004) introduced
seven test statistics that test the null hypothesis of no cointegration in
nonstationary panels. The seven test statistics allow heterogeneity in the
panel, both in the short-run dynamics as well as in the long-run slope and
intercept coefficients. Unlike regular time-series analysis, this tool does not
consider normalization or the exact number of cointegrating relationships.
Instead, the hypothesis test is simply the degree of evidence, or lack thereof,
for cointegration in the panel among two or more variables (Timothy Neal,
2014). Pedroni (1999) assumes a panel-specific cointegrating
vector, where all panels have individual slope coefficients. The panel
cointegration tests are obtained by testing for a unit root in the estimated
residuals using the ADF regression but allowing panel-specific ![]() _
instead of
_
instead of ![]() in the following equations:
in the following equations:
![]()
![]()
Equation 3. Pedroni Test for Cointegration for Panel Data. (Timothy Neal, 2014)
This heterogeneity distinguishes Pedroni tests from those derived by Kao. Likewise, Westerlund (2005) assumes panel-specific cointegrating vectors, where all panels have individual slope coefficients. The VR (Variance Ratio) test statistics are obtained by testing for a unit root in the predicted residuals using the DF regression.
Once we are done with Panel Unit Root Test and Cointegration Test, we are good to go with Vector Error Correction Modelling to find the Long Run Relationship between variables. If a set of variables are found to have one or more cointegrating vectors then a suitable estimation technique is a VECM (Vector Error Correction Model) which adjusts to both short run changes in variables and deviations from equilibrium. Lag length criteria also suggest the chosen of one lag for estimating VECM. (Dalia Maria Andrei, Liviu C. Andrei, 2015)

§ ![]()
§ ![]()
§ ![]()
§ ![]()
![]()
§ 
§ ![]()
§ ![]()
§ ![]()
§ ![]()
Equation 4. Vector Error Correction Modelling for Panel Data. (Engle and Granger ,1987)
Since we have been determined on methodology and research purpose, we can go ahead on data and its description for our further analysis.
4. Data and Description.
Data has been collected in accordance with methodology and availability of data in some sources. Accordingly, GDP of each region where 6 international airports located was collected as representative of regional economies namely Tashkent, Navoiy, Bukhara, Samarqand, Khorezm and Fergana from period starting 2000 till 2022. GPD variables are in national currency current values and has been changed into constant values with base year 2010. Moreover, as indicator of aviation, Air Passengers and Freight Carried was collected from 2000 till 2022 according each regional airport data provided by the Committee of Statistics of Uzbekistan. Thus, 3 variables were collected for further research, specifically from period starting 2000 till 2022, Gross Domestic Products in Current Values in UZS (National Currency of Uzbekistan), Air Passengers Carried over years in people, Air Freight Carried in tons.
Table 1. Descriptive Statistics of Regional GDPs, Air Freight and Passengers carried from 2000 till 2022. (The Statistics Committee of Uzbekistan)
|
Variables
|
GDP (in billion UZS) from 2000-2022
| |||||
|
International Airports
|
Tashkent
|
Samarqand
|
Navoiy
|
Bukhara
|
Khorezm
|
Fergana
|
|
Mean
|
12876.59
|
6876.28
|
5441.39
|
5109.62
|
3354.76
|
6583.14
|
|
Standard Deviation
|
6826.07
|
2991.13
|
3097.29
|
1798.01
|
1414.01
|
1893.52
|
|
Kurtosis
|
-0.71
|
-1.75
|
0.84
|
-1.13
|
-1.50
|
-1.18
|
|
Skewness
|
0.66
|
0.13
|
46753,00
|
0.12
|
0.28
|
0.36
|
|
Minimum
|
4988.99
|
3306.77
|
1840.16
|
2602.30
|
1671.76
|
4206.72
|
|
Maximum
|
27045.78
|
11138.07
|
12434.21
|
8336.46
|
5881.19
|
10178.05
|
|
Sum
|
296161.65
|
158154.33
|
125152.08
|
117521.15
|
77159.46
|
151412.12
|
|
No of Obs.
|
23.00
|
23.00
|
23.00
|
23.00
|
23.00
|
23.00
|
|
Variables
|
Air Passenger Traffic( thousand people)
from 2000-2022
| |||||
|
International Airports
|
Tashkent
|
Samarqand
|
Navoiy
|
Bukhara
|
Khorezm
|
Fergana
|
|
Mean
|
1404009.83
|
255274.57
|
38291.13
|
57070.39
|
37865.74
|
78709.70
|
|
Standard Deviation
|
390883.24
|
71069.73
|
10660.44
|
4151.02
|
10542.16
|
21913.19
|
|
Kurtosis
|
42005,00
|
42005,00
|
42005,00
|
20090,00
|
42005,00
|
42005,00
|
|
Skewness
|
0.55
|
0.55
|
0.55
|
-0.22
|
0.55
|
0.55
|
|
Minimum
|
616288.00
|
112052.00
|
16808.00
|
6372.00
|
16621.00
|
34549.00
|
|
Maximum
|
2432227.00
|
442223.00
|
66333.00
|
103185.00
|
65597.00
|
136352.00
|
|
Sum
|
32292226.00
|
5871315.00
|
880696.00
|
1312619.00
|
870912.00
|
1810323.00
|
|
No of Obs.
|
23.00
|
23.00
|
23.00
|
23.00
|
23.00
|
23.00
|
|
Variables
|
Air Freight Traffic million ton-km from
2000-2022
| |||||
|
International Airports
|
Tashkent
|
Samarqand
|
Navoiy
|
Bukhara
|
Khorezm
|
Fergana
|
|
Mean
|
35.76
|
7.80
|
25.76
|
2.77
|
1.55
|
3.21
|
|
Standard Deviation
|
17.70
|
0.63
|
6.18
|
1.08
|
0.59
|
0.26
|
|
Kurtosis
|
-0.07
|
0.05
|
1,10
|
0.07
|
-0.04
|
0.09
|
|
Skewness
|
0.37
|
0.20
|
-0.32
|
0.17
|
0.19
|
0.20
|
|
Minimum
|
5.60
|
1.80
|
9.8
|
0.60
|
0.40
|
0.70
|
|
Maximum
|
71.70
|
13.80
|
37.20
|
4.90
|
2.70
|
5.70
|
|
Sum
|
822.40
|
179.60
|
592.50
|
63.90
|
35.85
|
73.90
|
|
No of Obs.
|
23.00
|
23.00
|
23.00
|
23.00
|
23.00
|
23.00
|
In total 138 number of observations has been collected in 6 regions of Uzbekistan, namely Tashkent, Samarqand, Navoiy, Bukhara, Khorezm and Fergana. And we can see some specific economic changes by depicting it into line chart as below.
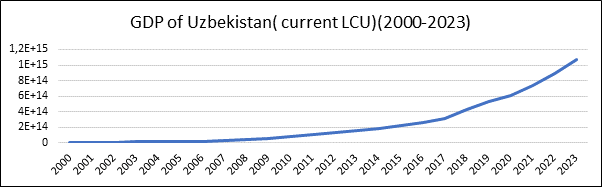
Chart 1. Gross Domestic Product of Uzbekistan from 2000 till 2023. (The Word Bank Open Data Source, 2024)
According to Chart we can see that Gross Domestic Product of Uzbekistan increased gradually from 2000 till 2023 in Current Values. The sharp increase can be noticed from 2010 and upward. It was decided to choose Current Values in Local Currency of Gross Domestic Product due to 2016 event in Uzbekistan. Where, Bank conversation rate has been equalized to Market Rate and there is a sharp up in data which may lead some more explanation in the Analysis.
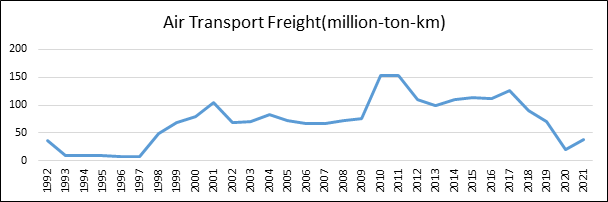
Chart 2. Air Transport Freight(million-ton-km). (The World Bank Open Data Source, 2024)
By Air Transport Freight chart, we can notice there are some ups and downs during the period starting from 1992 till 2021. Particularly, we can see some the impacts of Covid-19, where a slight sharp decrease has been identified. Additionally, it is important to mention the impact of building Air Hub in Navoiy Airport in 2008 and 2009 lead a sharp increase of Air Traffic of Uzbekistan after 2010 till 2013. The Decrease after 2013 could be explained by Project Stoppage from Korean Air Side.
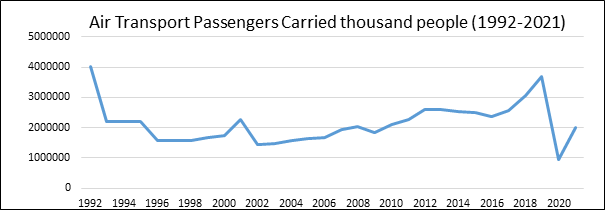
Chart 3. Air Passenger Carried from 1992 till 2021. (The World Bank Open Data Source, 2024)
If we look the Chart 3, we can clearly see that Air Passenger carriage over years from 1992 till 2021, where there were some ups and downs. Specifically, we should pay attention to sharp decrease of Air Passenger carriage after 1992 with reasoning that after Uzbekistan got independence from Soviet Union, the sharp decrease of Air Passenger carriage has been noticed. It is also possible to the impact of Covid-19, that shows sharp decrease after 2019 due to world lock down for quarantine happened during Pandemic Period. There are more important events can be described out of scope of our research.
5. Analysis and Results
Granger Causality process for Panel Data has been followed in the analysis using Stata and Eviews for Analyzing the Final Results with following Unit Root Test, Cointegration Test and Vector Error Correction Modelling.
Table 2. Levin Lu- Chu Panel Unit Root Test for checking Stationarity for variables GDP (constant values), Air Freight and Passenger Carried from 2000 till 2022
|
Region
|
Deterministic
|
GDP
|
Air Freight
|
Air Passenger
| |||
|
level
|
1st diff.
|
level
|
1st diff.
|
level
|
1st diff.
| ||
|
All (6 regions)
|
Intercept
|
-3941
|
-4,50 ***
|
0,81
|
-3,5769***
|
-2,8565***
|
-7,50***
|
|
Intercept+trend
|
-1,1537
|
-3,4537***
|
0,29
|
-1,9933***
|
-2,4995***
|
-5,3791***
| |
|
East (Tashkent-Fergana)
|
Intercept
|
0,511
|
-2,7345***
|
0,7811
|
-2,0817***
|
-1,4803
|
-4,3097***
|
|
Intercept+trend
|
-1,9418***
|
-2,0627***
|
0,3714
|
-1,2559
|
-1,2991
|
-3,1092***
| |
|
Central (Bukhara,Samarqand)
|
Intercept
|
-0,9491
|
-2,5362***
|
0,4464
|
-2,0870***
|
-2,0259***
|
-4,3841***
|
|
Intercept+trend
|
0,3345
|
-2,1525***
|
0,14
|
-1,1555
|
-1,7466***
|
-3,1019***
| |
|
West( Navoiy,Khorezm)
|
Intercept
|
-0,4689
|
-2,5923***
|
0,1716
|
-2,023***
|
-1,4803
|
-4,3097***
|
|
Intercept+trend
|
-0,5733
|
-1,8547***
|
-0,0159
|
-1,0356
|
-1,2991
|
-3,1091***
| |
According to Results of Levin Lu Chu Panel Unit Root Test, we have found out all Variables are stationary at the 1st difference with significance level 0,05 which means variables do not have unit root, then we are good to continue further to run Cointegration Test for Panel Data.
Table 3. Pedroni Cointegration Test for Panel data for Variables GDP (constant values), Air Freight and Air Passengers Carried (in regional sense) from 2000 till 2022
|
Regions
|
Deterministic
|
Pedroni
|
Westerlund
| ||
|
Rho
|
PP
|
ADF
|
Variance Ratio
| ||
|
All
|
GDP and Aviation
|
-3,353***
|
-4,9680***
|
-,2569***
|
-1,8329*
|
|
East
(Tashkent-Fergana)
|
-0,6068
|
-3,4479***
|
-3,277***
|
-1,1423
| |
|
Central
(Bukhara,Samarqand)
|
-2,3010***
|
-5,7015***
|
-6,033***
|
-1,2412
| |
|
West( Navoiy,Khorezm)
|
-0,7963
|
-3,4996***
|
-2,1893***
|
-0,7913
| |
According to Results of Pedroni Test which contains 3 type of tests such as Augmented Dickey Fuller Test, Philip Peron Test and Modified Philip Peron Tests and Westerlund Test for Cointegration, we have found out that there is a cointegrating Vectors among variables such as GDP, Air Freight and Passengers. Which means that it is good to fulfill the results with Vector Error Correction Modelling.
Table 4. Vector Error Correction Modelling for Panel Data with Air Freight, Air Passenger and GDP in a regional level, Results.
|
Region
|
Dependent Variable
|
ECT
|
GDP ∆Lag(-1)
|
GDP ∆Lag(-2)
|
Air Passenger ∆Lag(-1)
|
Air Passenger
∆Lag(-2)
|
Air Freight ∆Lag(-1)
|
Air Freight ∆Lag(-2)
|
|
All (6 regions)
|
GDP>Air Passenger
|
-0,303***
|
0,235***
|
0,234***
|
-0,177***
|
-0,282***
|
-
|
-
|
|
Air Passenger >GDP
|
-0,105
|
0,255*
|
0,391***
|
-0,637***
|
-0,407***
|
-
|
-
| |
|
GDP>Air Freight
|
-0,315***
|
0,116
|
0,041
|
-
|
-
|
-0,15***
|
-0,286***
| |
|
Air Freight >GDP
|
-0,016
|
-0,163
|
0,2
|
-
|
-
|
-0,097
|
0,022
| |
|
East
(Tashkent-Fergana)
|
GDP>Air Passenger
|
-0,52***
|
0,36*
|
0,401*
|
-4,93E-05***
|
-6,75E-05***
|
-
|
-
|
|
Air Passenger >GDP
|
-4241,299**
|
4314,67*
|
4325,23*
|
-0,796***
|
-0,688***
|
-
|
-
| |
|
GDP>Air Freight
|
-0,382***
|
0,08
|
0,04
|
-
|
-
|
-0,94
|
-1,14 *
| |
|
Air Freight >GDP
|
-0,032
|
-0,015
|
0,012
|
-
|
-
|
0,04
|
-0,29
| |
|
Central(
Bukhara-Samarqand)
|
GDP>Air Passenger
|
-0,289***
|
0,234
|
0,256
|
-7,74E-05
|
-0,0001**
|
-
|
-
|
|
Air Passenger >GDP
|
-849,91
|
1439,497
|
1750,37
|
-0,71***
|
-0,56***
|
-
|
-
| |
|
GDP>Air Freight
|
-0,30***
|
0,112
|
0,099
|
-
|
-
|
-1,71
|
-2,702
| |
|
Air Freight>GDP
|
-0,016
|
0,0004
|
0,012
|
-
|
-
|
-0,037
|
-0,268
| |
|
West (Navoiy-Khorezm)
|
GDP>Air Passenger
|
-0,521***
|
0,204
|
0,181
|
-0,001***
|
-0,001***
|
-
|
-
|
|
Air Passenger>GDP
|
45,25
|
-131,28
|
37,17
|
-0,466*
|
-0,261
|
-
|
-
| |
|
GDP>Air Freight
|
-0,489***
|
0,304
|
0,416**
|
-
|
-
|
-1,018
|
-2,17***
| |
|
Air Freight >GDP
|
-0,08***
|
0,011
|
0,09
|
-
|
-
|
-0,143
|
-0,445***
|
According to Results of VECM model, we can say that there is a long-term unidirectional causality between Aviation and GDP, since according to significant results which states that Both Air Freight and Air Passenger Granger causes Regional GDP in the long run, while there is no relationship on GDP towards Air Freight and Air Passenger in the long run. In the case of all regions, any disequilibrium in the short run corrected by 3,03 % speed of adjustment every period in the direction of Air Passenger to GDP. And Any disequilibrium in the short run corrected by 3,15 % speed of adjustment every period in the case of Air Freight to GDP. All Results are statistically significant.
In the case of VECM results by dividing into sub groups according to geographical location, we can say that there is the same long run unidirectional relationship between GDP and Aviation, where Aviation variables such as Air Traffic and Air Passenger Granger causes GDP of regions in the long run. Moreover, there are some short run relationships also exist, such as in the case of East Regions like Tashkent and Fergana, we can see that Air Passenger Facilitates GDP in the short run, while Air Freight facilitates GDP in 2 year period at once. In the case of Bukhara and Samarqand, we can see the GDP facilitates Air Passenger Traffic in the long run, which clearly reasons the Bukhara and Samarqand’s current position as regions in Uzbekistan since these cities fully touristic locations of Uzbekistan. In the case of Navoiy and Khorezm, we can say that Air Freight can facilitate Economic Enhancement in the short run, so that Navoiy Airport is actually considered to be freight hub for Korean air and Uzbekistan Airways to link Asia with Europe.
6. Conclusions and Implications
As we mentioned earlier, it is vital to make wise decision in terms of transport infrastructure in developing countries. Thus, resources are scarce and require the best allocation of it in the long run. Moreover, Air Transport is a special sector where the demand air freight is highly correlated with value of the goods while economic impact is crucial due to passenger carriage links one’s country with another one.
As purpose of finding relationship between regional economies of Uzbekistan with its Aviation Industry, panel data has been collected and Granger Causality Test for Panel Data has been processed to quantify the relationships between Air Transport and Regional Economy. Accordingly, it was found out that there is a long run unidirectional relationship between Aviation and Economic Development of the Regions in the long run, while Aviation can Granger Causes Regional GDPs in the long-term, while it is true in the case of all regions in both air freight and air passenger term. Nevertheless, the impact of the speed of adjustment actually differs region by region according to economic characteristics of the region such as whether region is dedicated for tourism or air transport hub or region is capital and so on.
According to the results, we can imply that Aviation in Uzbekistan has a potential to drive the economic growth in a regional level, while the impact of it in each regions differ, so investment should be allocated accordingly through the regions. Consequently, since the passenger and freight air infrastructure differ, we need to consider crucial allocation of resources. Thus, we should focus on more on-air freight development in Navoiy Regions, while need to facilitate Air passenger Carriage in Samarqand and Bukhara. Since Tashkent is capital, both Air Passenger and Air Traffic equally be treated.
Страница обновлена: 29.07.2026 в 17:52:55
Download PDF | Downloads: 46
The Impact of Air Transportation on Regional Economic Growth, the Case of Uzbekistan
Usmanov A.MJournal paper
Journal of Central Asia Economy
Volume 9, Number 2 (April-June 2025)
Abstract:
Purpose – The purpose of this study is to quantify the impact of aviation on regional economic efficiency, as the total cost on building and operating of air transport infrastructure is high but vital and economically wise decisions should be made from related parties, to prioritize investments on transport infrastructure with an analysis-based approach quantitatively.
Design/Methodology/Approach- this study proposes Granger Causality Test for panel data, since it is not also good indicator of causality between variables over period of time but also shows direction and the speed of contribution quantitatively, so that decision makers can categorize investment priorities, especially when it comes to transport sector investment-related decisions in developing countries.
Findings – The Results of analysis demonstrate that there is a long run relationship between aviation and regional economies, where aviation can facilitate economic growth in the long run. Specifically, it was confirmed that Air Passenger Movement brings more positive impact on economies in touristic places while air freight carriage in air freight hub airports may lead to economic positive changes in the long run in 6 regions of Uzbekistan, namely Tashkent, Bukhara, Samarqand, Navoiy and Fergana. That is the usual pattern which all developed countries experienced in the past, which can naturally mean that Uzbekistan`s economy along with aviation is following natural pattern of economic and infrastructural growth, with acceptable shadow or artificial involvements.
Originality/Value - this kind of research is traditional in transportation economics in developed countries in the past, while in developing countries like Uzbekistan, no this kind of research has been conducted before.
Keywords: Granger Causality, Panel Data, Aviation, Regional Economies, Investment on Transportation
JEL-classification: L62, L91, L93