
Economic assessment of the effect of adopting generative artificial intelligence tools in the marketing of small and medium-sized businesses
Seredinskaia D.S.1 
1 Финансовый университет при Правительстве Российской Федерации, Москва, Россия
Статья в журнале
Маркетинг и маркетинговые исследования (РИНЦ, ВАК)
опубликовать статью
Том 32, Номер 1 (Январь-март 2027)
Introduction
Generative artificial intelligence (AI) has transitioned from pilot projects to routine organizational operations. According to a McKinsey global survey conducted in May–June 2026, nearly 90% of respondents reported regular AI use in at least one business function, yet only 37% observed any impact on earnings before interest and taxes (EBIT) [28]. Among small and medium-sized enterprises (SMEs), adoption rates are lower but still significant: a representative OECD survey of over 5,000 SMEs across seven countries found that 31% of firms used generative AI in 2024, primarily for text generation and basic tasks such as drafting documents, managing e-mail, and preparing marketing copy [25].
The economic rationale for adopting generative tools in SME marketing is twofold. First, small firms experience what J. Welsh and J. White term resource poverty, characterized by limited financial and human resources, with owners often performing multiple managerial roles [29]. In these firms, the owner, a small team, or external contractors typically manage marketing responsibilities. Content production, including social media posts, newsletters, and product or service descriptions, is labor-intensive and recurrent, consuming a substantial portion of available capacity. Second, experimental studies have documented significant reductions in the time required for writing tasks with generative assistance: a 40% reduction in mid-level professional writing tasks, such as press releases [24], and approximately 25% in consulting tasks involving idea generation and marketing copy drafting [14]. At the functional level, generative AI is estimated to increase marketing productivity by 5–15% of total marketing expenditure [13]. For SMEs, even partial time savings represent a valuable resource.
However, evidence of tangible economic outcomes is less compelling. A survey of over 550 SME leaders in the United States, Canada, and Australia found that while more than 70% held a positive view of AI, nearly 40% had not observed measurable results from AI initiatives [17]. Among participants in the Goldman Sachs 10,000 Small Businesses program, 76% reported using AI, yet only 14% considered it fully integrated into core operations [19]. Studies combining survey responses with administrative data (official register records collected by public authorities for purposes other than research, such as records of earnings and working hours) yield similar findings: in Denmark, AI chatbots were widely adopted across eleven occupations, including marketing, but average time savings were limited to approximately 3% of working hours, with no significant impact on earnings or recorded hours [21]. Consequently, the managerial focus has shifted from the decision to adopt generative tools to the challenge of measuring their return, underscoring the relevance of the present study.
Literature Review
The literature provides several explanations for the discrepancy between adoption and realized results. Research on the business value of information technology indicates that the impact of digital investments is contingent on complementary organizational resources, such as work practices, skills, and management processes, rather than the technology alone [10; 23]. For general-purpose technologies, this dynamic produces a “productivity J-curve,” where firms initially incur unmeasured costs to develop complementary intangible assets, potentially resulting in a temporary decline in measured productivity [12]. In the context of generative AI, field experiments reveal that performance gains vary by task. For example, in customer support, generative assistants increased the number of issues resolved per hour by 15%, primarily among less experienced agents [11]. In consulting, performance improved for tasks within the “frontier” of AI capabilities, but for tasks beyond this frontier, consultants using AI were less likely to produce correct solutions than those without AI assistance [14]. In writing experiments, most participants with access to chatbots submitted unedited or minimally edited model outputs [24], highlighting concerns about quality control when content is directed at customers.
In marketing research, M.-H. Huang and R. Rust differentiate between mechanical, thinking, and feeling AI, which correspond to standardization, personalization, and relationship building in marketing, respectively [20]. Routine content production aligns most closely with the first two categories, while relational tasks remain predominantly human-driven. N. Kshetri et al. review generative AI applications in marketing, emphasizing content creation and personalized customer communication, and identify risks such as inaccurate outputs and intellectual property infringement [22]. Y. Dwivedi et al. discuss similar risks in broader business contexts [16]. A field experiment in content marketing demonstrated that texts generated by language models and refined by human editors were nearly indistinguishable from those produced by search engine optimization experts, achieved higher search rankings, and were less costly to produce; however, the essential role of the human editor is emphasized [26]. While generative assistance enhances individual creativity, it also increases the similarity of content across outputs, potentially diminishing brand distinctiveness [15].
In Russian-language publications, the use of AI in marketing is considered mainly at the level of tools and practices: machine learning in digital marketing [1], modern promotion tools [2], social media communications [5] and intelligent marketing automation, for which low trust in the technology and insufficient competencies are named as the main barriers [9]. The economic and organizational aspects of AI are examined at the level of enterprise management [3], business models [6] and business-process transformation, where technological complexity, organizational resistance and high implementation costs are reported as the most frequent barriers [8]. Direct calculations of economic effects are rare; one example estimates labor-cost savings from generative neural networks in marketing research for an analytical team of four [7]. Most of these studies focus on medium and large companies or assume analytical resources that small firms usually lack.
In summary, the literature documents time savings for individual tasks and acknowledges the significance of organizational factors. However, it does not provide an assessment method that SMEs can independently implement using existing data, nor one that incorporates the costs of editing and verifying generated content. For clarity, this study defines two terms precisely. A generative marketing tool refers to software based on a generative model that produces text, images, or other content for marketing communications in response to user instructions (prompts). The study identifies three categories of such tools: general-purpose language models (e.g., ChatGPT, Claude), image generators (e.g., Midjourney, Kandinsky), and generative features integrated into marketing platforms such as design editors, e-mail services, and advertising accounts. A marketing activity is defined as a specific task performed by the firm, such as preparing a newsletter issue. The same activity may be executed with or without a generative tool; the tool modifies the time and quality parameters of the activity, but not the activity itself.
Research Problem, Aim, Objectives, and Hypotheses
The literature review demonstrates that current assessment methods fail to address the gap between the widespread adoption of generative tools and the absence of measurable economic outcomes. Experimental studies primarily quantify time savings [11; 14; 24], while industry surveys focus on adoption rates and perceptions (Table 1). However, neither approach considers the costs of control and rework, nor does it address how small and medium-sized enterprises (SMEs) can use released time in a reproducible way with their own data. Consequently, the research problem is defined as a measurement issue: determining how an SME can estimate the net economic effect of a generative tool using data readily available within the organization.
This study seeks to develop a method for assessing the net economic effect of adopting generative tools in SME marketing, using data readily available within the firm. The method will be tested on a parameterized example. To achieve this aim, the following objectives, derived from the gaps identified in the literature, are established:
1. to systematize published evidence regarding the adoption of generative tools and realized outcomes, and to identify the measurement gap (Introduction and Literature Review; Table 1);
2. to compare approaches for evaluating digital investments, including resource savings, output gain, and total cost of ownership, by their data requirements and applicability to SMEs (Table 3);
3. to construct a deterministic model of the net economic effect, linking each cost and benefit component to a measurable parameter of content production, including editorial control (Equations 1-6; Table 4; Figure 2);
4. to parameterize the model using time-saving rates from published experimental studies and to test the hypotheses through scenario and threshold analysis (Tables 5-9);
5. to formulate a procedure that SMEs can apply using their own data (Discussion).
The literature review informs the hypotheses. Research on the business value of information technology indicates that the impact of digital investments depends on complementary organizational resources, not technology alone [10; 23]. Additionally, evidence from writing and content-marketing experiments highlights the critical role of human editing and control over generated output [24; 26]. This leads to the first hypothesis:
H1. For a given time-saving rate, the sign of the net effect is determined by organizational conditions, particularly the structure of editorial control, which influences the proportion of content requiring rework.
Experimental studies quantify time savings but do not consider the costs of control and rework, and they assume that released time is used productively. In contrast, a study linking survey responses with administrative data finds no significant effect on earnings or recorded hours [21]. Furthermore, unmeasured intangible costs may also reduce measured returns [12]. This leads to the second hypothesis:H2. Time savings reported in experimental studies significantly overstate the economic effect in SME practice, as these studies do not account for control and rework costs and assume that released time is used productively.
Objective 4 tests both hypotheses. The test indicators and decision rules are provided at the end of the Materials and Methods section (Table 7). The study contributes by framing the gap between adoption and realized returns as a measurement issue and by proposing a model that links each cost and benefit component to a measurable content-production parameter, including editorial control.Materials and Methods
Research design
This study is conceptual and model-based and relies exclusively on secondary data. Secondary data refer to information previously collected and published by other researchers and organizations, including peer-reviewed studies and analytical or industry reports; these were obtained through desk research. No primary data, defined as data collected specifically for this study through surveys, experiments, or structured observations, were gathered. The methodology integrates several approaches: analytical review of published sources, comparative analysis of digital investment evaluation methods, deterministic mathematical modeling, scenario analysis, and threshold (break-even) analysis.The sole primary source is the author's professional experience consulting Russian-speaking online experts, including coaches, educators, and consultants serving a Russian-language audience. Methodologically, this constitutes non-systematic participant observation of the content-production process. This experience was utilized qualitatively to define activities and roles within the content-production process (see Tables 2 and 5), rather than as a source of statistical data.
The selection of secondary data and desk research is justified by four considerations. First, the study focuses on developing an assessment method, which must be constructed and evaluated for internal consistency prior to field application. Second, published controlled and field experiments involving samples ranging from several hundred to several thousand participants have already measured the time-saving rates required by the model [11; 14; 24]. Surveys of small and medium-sized enterprises (SMEs) cannot replicate these measurements, as existing SME leader surveys (see Table 1) capture adoption and perceptions rather than task-level time and cost data. Third, the organizational parameters of the model, such as the share of rework, time per revision, time for control, and training costs, have not been measured in published SME marketing studies. Measuring these parameters would require firms to maintain detailed time logs over several weeks, which is planned for subsequent research and presupposes a validated model. Fourth, a simulated case with explicit scenario assumptions clarifies the contribution of each parameter, whereas a small empirical sample would confound organizational factors.
The research was conducted in five stages, each aligned with a specific objective (see Figure 1): (1) analytical review of published research and industry survey data; (2) comparison of approaches to evaluating digital investments; (3) construction of the net-effect model (Equations 1-6); (4) parameterization of the model using time-saving rates from published experimental studies, followed by scenario and threshold analysis and testing of hypotheses H1 and H2; and (5) formulation of a practical procedure for SMEs. Parameterization refers to fitting the model's parameters to values reported in published studies, thereby testing the hypotheses with realistic parameter values. In practical applications, SMEs would use their own data to populate the model.
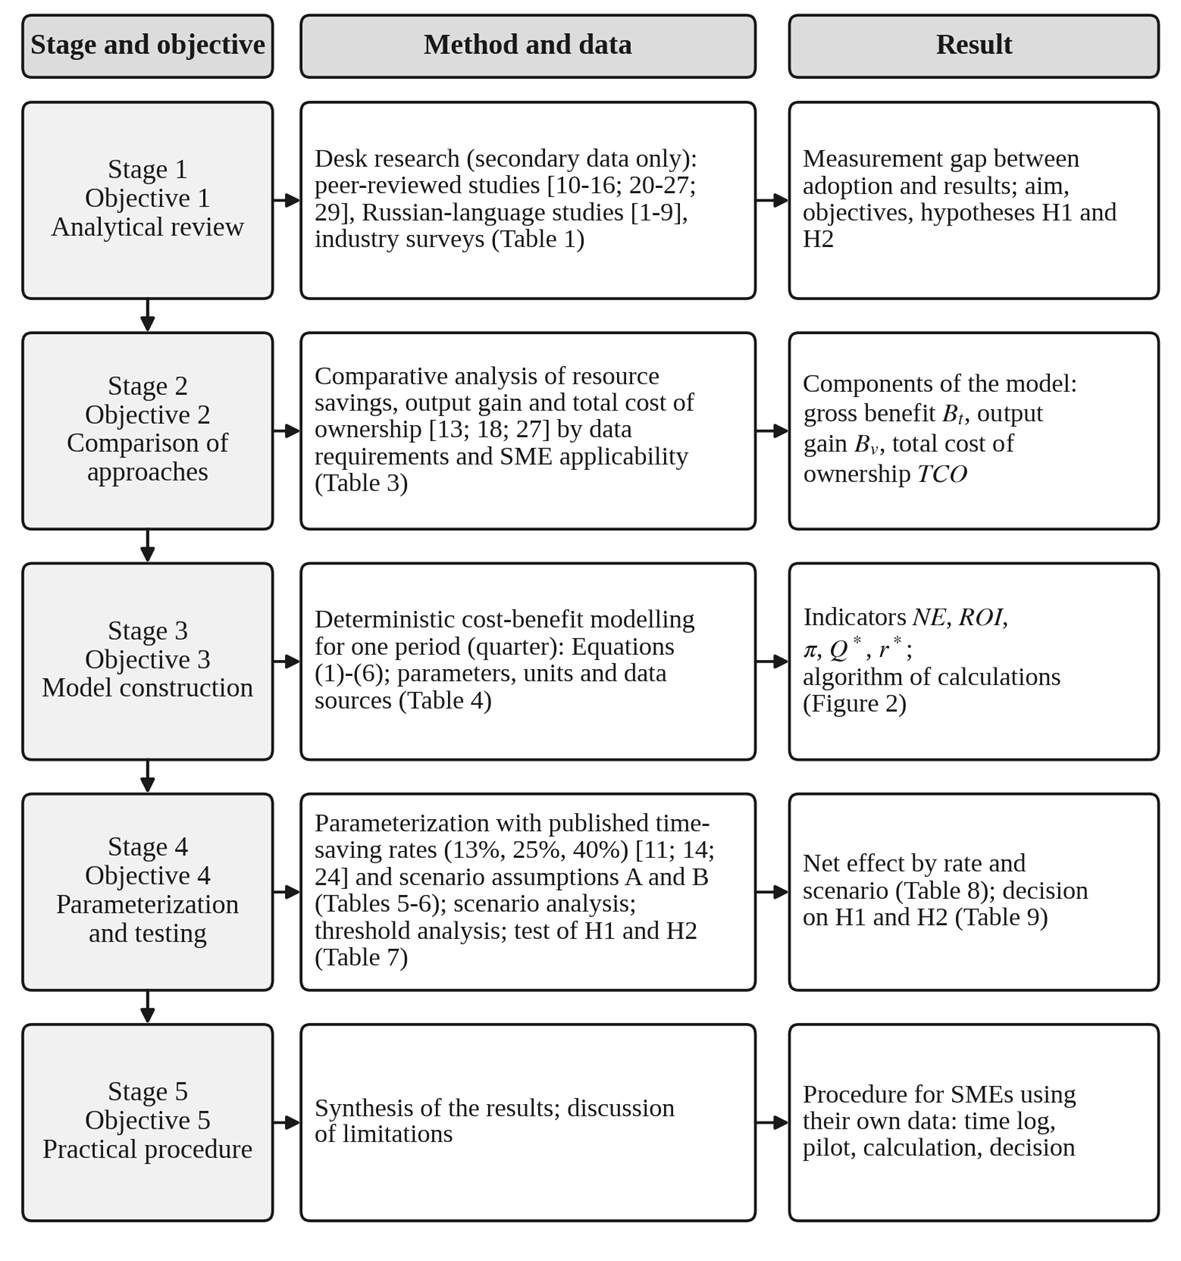
Figure 1. Research design: stages, methods, data, and results of the study
Source: compiled by the author
Data sources and selection criteria
Source selection followed specific criteria. Estimates of the productivity effect of generative AI were drawn from peer-reviewed experimental and quasi-experimental studies with fully described research designs, including sample, task, treatment, and control conditions [11; 14; 24], as well as from a study linking survey responses with administrative register data (official Danish register records on earnings and recorded working hours) [21]. Administrative data refer to records public authorities collect for purposes other than research, such as tax and payroll registers. Marketing-specific evidence was sourced from peer-reviewed marketing and information management journals [20; 22; 26]. Russian-language studies were identified through keyword searches (artificial intelligence, generative AI, marketing, economic effect) in the archives of peer-reviewed Russian economic journals; studies addressing AI in marketing or the economic effects of AI in business were retained (nine studies [1-9]). Industry surveys were included only if the conducting organization, sample, geography, and fielding period were reported (Table 1). These surveys were used to describe the scale of adoption and the gap between adoption and realized economic results, but not to estimate model parameters, because they differ in samples and definitions and do not measure time or costs at the level of individual tasks.Table 1
Industry surveys used as secondary data: adoption, results, and the gap between them
|
Survey (organization)
[source]
|
Period
|
Sample and geography
|
Adoption indicator, %
of respondents
|
Result indicator, % of
respondents
|
Gap between
adoption and results, p.p.
|
|
Survey on generative AI and the SME workforce (OECD)
[25]
|
2024
|
Representative survey of over 5,000 SMEs in Austria,
Canada, Germany, Ireland, Japan, Korea and the United Kingdom
|
Share of SMEs using generative AI: 31 (mainly text
generation, drafting documents, e-mail, marketing copy)
|
Not measured
|
Not estimable: the survey has no results indicator
|
|
2026 AI Readiness Report (ECI Software Solutions)
[17]
|
November 2025
|
Over 550 SME leaders in manufacturing, distribution,
construction, field service and related industries; USA, Canada, Australia
|
Positive view of AI: over 70; use for content
creation: 40 and for marketing tasks: 33
|
No measurable results yet: nearly 40
|
≈ 40 (reported directly
as the share of leaders without measurable results)
|
|
10,000 Small Businesses Voices – 4 (Babson College
and David Binder Research for Goldman Sachs) [19]
|
27 January – 4 February 2026
|
1,256 small business owners, participants of the
program; USA
|
Use of AI: 76
|
Full embedding in core operations: 14
Additional finding: need for training, 73 |
62 (76-14)
|
|
The state of AI (McKinsey & Company) [28]
|
4 May – 8 June 2026
|
Online survey of 1,719 respondents in 97 countries,
all company sizes and industries
|
Regular use of AI in at least one company function:
nearly 90
|
Impact on EBIT: 37
|
≈ 53 (90-37)
|
Table 1 indicates that, where both indicators are available, the proportion of firms using AI exceeds the proportion reporting measurable or fully integrated results by approximately 53 to 62 percentage points (McKinsey; Goldman Sachs). Additionally, nearly 40% of SME leaders surveyed by ECI report no measurable results. Because survey samples and definitions differ, these gaps are indicative and not comparable across surveys. Instead, they define the research problem and are not used as model parameters.
Object of assessment and time tracking
This assessment examines the production of text-based marketing content, the primary domain in which small and medium-sized enterprises (SMEs) use generative tools [17; 25] and can systematically track time spent. In the proposed model, the individual responsible for marketing within the firm generates content, such as the owner, a content or social media specialist, or an external copywriter (see Table 5). Time tracking is implemented by requiring the performer to maintain a time log that records the time allocated to each content unit, including brief and prompt preparation, generation, initial editing, and time spent on each revision. Maintain this log for four to six weeks before adoption and throughout a one- to two-month pilot period after adoption (see Table 4). Table 2 outlines the relevant activities, applicable tool categories, and the division of labor between the tool and the individual. The delineation of activities and typical editorial roles (such as briefing the tool, verifying factual accuracy and brand voice, and approving or returning drafts for revision) draws on the author’s consulting experience with Russian-speaking online experts, including coaches, educators, and consultants serving a Russian-language audience. This experiential knowledge was applied qualitatively to structure the content production process, rather than as a source of statistical data.Table 2
Marketing activities of SMEs and generative tools applicable to them
|
Marketing activity
|
Content unit
|
Applicable generative
tools
|
Role of the tool
|
Role of the
person (editorial functions)
|
Included in the model
|
|
Social media communication
|
Post with caption; short video script
|
Language models (ChatGPT, Claude); image generators
(Midjourney, Kandinsky)
|
Draft text, visual variants
|
Topic, facts, brand voice; replies to the audience
|
Yes
|
|
E-mail marketing
|
Newsletter issue
|
Language models; generative functions of e-mail
services
|
Draft, subject line variants
|
Offer, terms, compliance with mailing rules
|
Yes
|
|
Product and sales texts
|
Product or service description; landing page section
|
Language models; generative functions of website
builders
|
Draft structure and text, adaptation to formats
|
Product facts, prices, claims
|
Yes
|
|
Advertising
|
Set of ad copy variants and creatives
|
Language models; image generators; generative
functions of advertising accounts
|
Variants for testing
|
Selection, compliance with advertising rules, budget
|
Yes
|
|
Positioning, pricing, channel strategy
|
No standard unit (decisions)
|
Language models as an assistant
|
Ideas, summaries of sources
|
Decision-making; outside the scope of the model
|
No
|
The first four activities produce standardized content units and are included in the net-effect model developed below (Equations 1-6). Strategic tasks are excluded, as their outcomes cannot be measured by the time of content production and rely primarily on human judgment [20]. A content unit is a finished text item from Table 2 that has passed internal approval and is ready for publication.
Approaches to assessing the economic effect
In line with IT business value literature, digital investments are defined as firm expenditures on acquiring and implementing digital technologies, including software, subscriptions, data, staff training, and process changes, made in expectation of future economic benefits [10; 23]. At the macroeconomic level, AI is argued to reshape the investment multiplier, that is, the extent to which investment translates into economic growth [4]. Subscriptions to generative tools, along with related training and process changes, are considered such investments, so IT investment evaluation methods apply. Three approaches are compared by what they measure, required data, SME applicability, and main limitations (Table 3). Approaches needing end-to-end analytics or long statistical series, such as econometric marketing mix models (regression models that estimate the contribution of marketing channels to sales from long time series of marketing spending and sales), are excluded, as small firms typically lack this infrastructure [29].The resource-savings approach assesses the value of released working time based on labor costs. Released working time is defined as the difference in time required to produce a content unit before and after adoption, multiplied by the number of units (measured in hours per period). Labor cost is calculated as the performer’s total hourly cost in rubles, which includes the contract rate for external contractors or, for employees in Russia, the gross salary plus mandatory employer social insurance contributions per working hour. Only the portion of released time that is either unpaid or redirected to value-creating activities is considered to have economic value, as represented by the share u in Equation 1. It underlies estimates of the economic potential of generative AI [13] and calculations for marketing research teams [7], and it is the most accessible for small firms. Its weakness is that released time is not the same as money saved: savings materialize only if the released hours are either unpaid or redirected to value-creating work [12; 21]. The output-gain approach assesses changes in marketing outcomes, including reach, leads, and conversion [27]. This method aligns with business objectives but requires systematic outcome tracking through web analytics, tagged links, or CRM data. Additionally, it requires controlling for external factors unrelated to the tool, such as seasonality, price fluctuations, advertising budget, and competitors’ actions. In contrast, it focuses on factors directly related to the tool, such as the quality and frequency of published content. This is feasible in a field experiment [26] but rarely in a small firm. The total cost of ownership (TCO) approach, developed in purchasing, accounts for all costs of acquiring and using a resource over its life cycle rather than its price alone [18]. It is necessary for comparing costs with benefits but does not measure the effect on its own. Since none of the approaches is sufficient on its own for an SME, the proposed model combines them in a single indicator.
Table 3
Approaches to assessing the economic effect of adopting generative tools in marketing
|
Approach
|
What it measures
|
Required data
|
SME applicability
|
Main limitations
|
Role in the
proposed model
|
|
Resource savings
|
Released working time in monetary terms
|
Task time per content unit before and after adoption
of the generative tool (hours); labor cost per hour (rubles)
|
High: data are collected by the firm itself
|
Overstates the effect if released time is not used
and costs are ignored
|
Gross benefit Bt (Equation 1)
|
|
Output gain
|
Change in marketing outcomes (reach, leads,
conversion)
|
Outcome tracking by the owner or marketer (web
analytics, tagged links, CRM data); control of external factors unrelated to
the tool (seasonality, prices, advertising budget, competitors’ actions)
|
Moderate: requires an analytics system
|
Influence of factors unrelated to the tool
|
Benefit Bv (set to zero without
outcome tracking)
|
|
Total cost of ownership
|
Full costs of the tool over the period
|
Subscription, training, rework and control costs
|
High, but does not measure the effect on its own
|
Records costs without relating them to benefits
|
Costs TCO (Equation 2)
|
Table 3 shows that these approaches complement each other. Resource savings provide measurable benefits for individual firms, output gains introduce benefits that necessitate outcome tracking, and total cost of ownership addresses the cost dimension, including rework and control.
Model and algorithm of calculations
The model is a deterministic cost–benefit model for a single period (a quarter), comparing benefits from resource-savings and output-gain approaches with total cost of ownership. The model is deterministic because all parameters are fixed values and no probability distributions are used. Table 4 summarizes the model’s elements, their units, how firms obtain their values, and the basis for each. The sequence of calculations is shown in Figure 2. The gross benefit from released working time isBt = u · Q · (t0 − t1) · c, t1 = (1 − s) · t0 (1)
where Q is the number of content units produced in the period (units per quarter); t0 and t1 are the performer’s time per unit before and after adoption (hours per unit), including the preparation of the prompt and first-pass editing of the draft; s is the time-saving rate (share of the baseline time, %); c is the performer’s full hourly labor cost (rubles per hour); u is the share of released time that is not paid for or is redirected to value-creating work (dimensionless, 0 ≤ u ≤ 1). For an external contractor paid by the hour, u = 1; for a salaried employee, u is estimated from how the released hours are actually used. The benefit from output gain is Bv = m · ΔV, where ΔV is the additional sales volume attributable to adoption (units of sales per quarter) and m is the marginal contribution per unit of sales (rubles per unit of sales); without outcome tracking, Bv is set to zero. Both benefits are expressed in rubles per quarter. The total cost of ownership for the period is
TCO = S + L + E + K, E = Q · r · tw · c, K = Q · tk · ck (2)
where S is the cost of subscriptions and related services (rubles per quarter); L is the one-off cost of staff training and of preparing editorial standards (brand voice guide, prompt library, checklist), apportioned to the period (rubles per quarter); E is the cost of rework (rubles per quarter), determined by the share r of units returned for substantial revision (dimensionless) and the time tw per revision (hours); K is the cost of control (rubles per quarter), determined by the controller’s time tk per unit (hours per unit) and the controller’s hourly cost ck (rubles per hour). E and K are counted as increments over the control practice that existed before adoption. The net effect and the return on investment are
NE = Bt + Bv − TCO, ROI = NE / TCO (3)
where NE is measured in rubles per quarter and ROI is dimensionless (rubles of net effect per ruble of costs). Unlike S and L, the costs E and K grow in proportion to volume, so only fixed costs can be covered by increasing the number of units. The net saving per unit is
π = u · s · t0 · c + m · Δv − r · tw · c − tk · ck (4)
where Δv = ΔV / Q is the output gain per content unit (units of sales per content unit), and π is measured in rubles per unit, and the break-even volume (units per quarter) is
Q* = (S + L) / π (5)
If π ≤ 0, adoption does not pay off at any volume: the saving on each unit is consumed by its control and rework. Solving NE = 0 for r gives the maximum tolerable share of rework (dimensionless) at a given volume (with Bv = 0):
r* = [u · s · t0 · c − tk · ck − (S + L) / Q] / (tw · c) (6)
Indicators (5) and (6) answer the practical questions of the owner: what regular volume of content justifies the tool at the given rates, and what share of defective drafts the business can afford.
Table 4
Elements of the model, their units, and sources of their values
|
Symbol
|
Meaning
|
Unit
|
How the
firm obtains the value
|
Basis (source)
|
|
Q
|
Content units produced in the period
|
units per quarter
|
Content plan, publication log
|
Table 2
|
|
t0, t1,
s
|
Performer’s time per unit before and after adoption;
time-saving rate
|
hours per unit; % of t0
|
Time log for 4–6 weeks before adoption and during a
pilot
|
[11; 14; 24]
|
|
c
|
Performer’s full hourly labor cost
|
rubles per hour
|
Contract rate, or salary with payroll charges per
working hour
|
[7; 13]
|
|
u
|
Share of released time not paid for or redirected to
value-creating work
|
dimensionless, 0-1
|
1 for hourly contractors; for staff, from the actual
use of released hours
|
[12; 21]
|
|
m,
ΔV
|
Marginal contribution and additional sales due to
adoption
|
rubles per unit of sales; units of sales per quarter
|
Only with outcome tracking (tagged links, CRM data)
|
[26; 27]
|
|
S
|
Subscriptions and related services
|
rubles per quarter
|
Tariffs of the services used
|
[18]
|
|
L
|
Training and editorial standards, apportioned to the
period
|
rubles per quarter
|
Hours of training and development multiplied by
rates
|
[10; 18; 23]
|
|
r,
tw
|
Share of units returned for rework; time per
revision
|
dimensionless, 0-1; hours per revision
|
Log of returned units
|
[22; 24; 26]
|
|
tk, ck
|
Controller’s time per unit; controller’s hourly cost
|
hours per unit; rubles per hour
|
Controller’s time log; owner’s opportunity cost
|
[21; 26]
|
|
Bt, Bv
|
Gross benefit from released time; benefit from
output gain
|
rubles per quarter
|
Calculated
|
Equation (1)
|
|
E,
K, TCO
|
Cost of rework; cost of control; total cost of
ownership
|
rubles per quarter
|
Calculated
|
Equation (2)
|
|
NE, ROI
|
Net effect; return on investment
|
rubles per quarter; dimensionless
|
Calculated
|
Equation (3)
|
|
π,
Q*, r*
|
Net saving per unit; break-even volume; maximum
tolerable share of rework
|
rubles per unit; units per quarter; dimensionless
|
Calculated
|
Equations (4)-(6)
|
Table 4 links each model element to a measurable parameter, a unit of measurement, and a data source: the input parameters come from the firm’s records (content plan, time logs, contracts, tariffs), and the remaining indicators are calculated from them. Figure 2 shows the calculation algorithm.
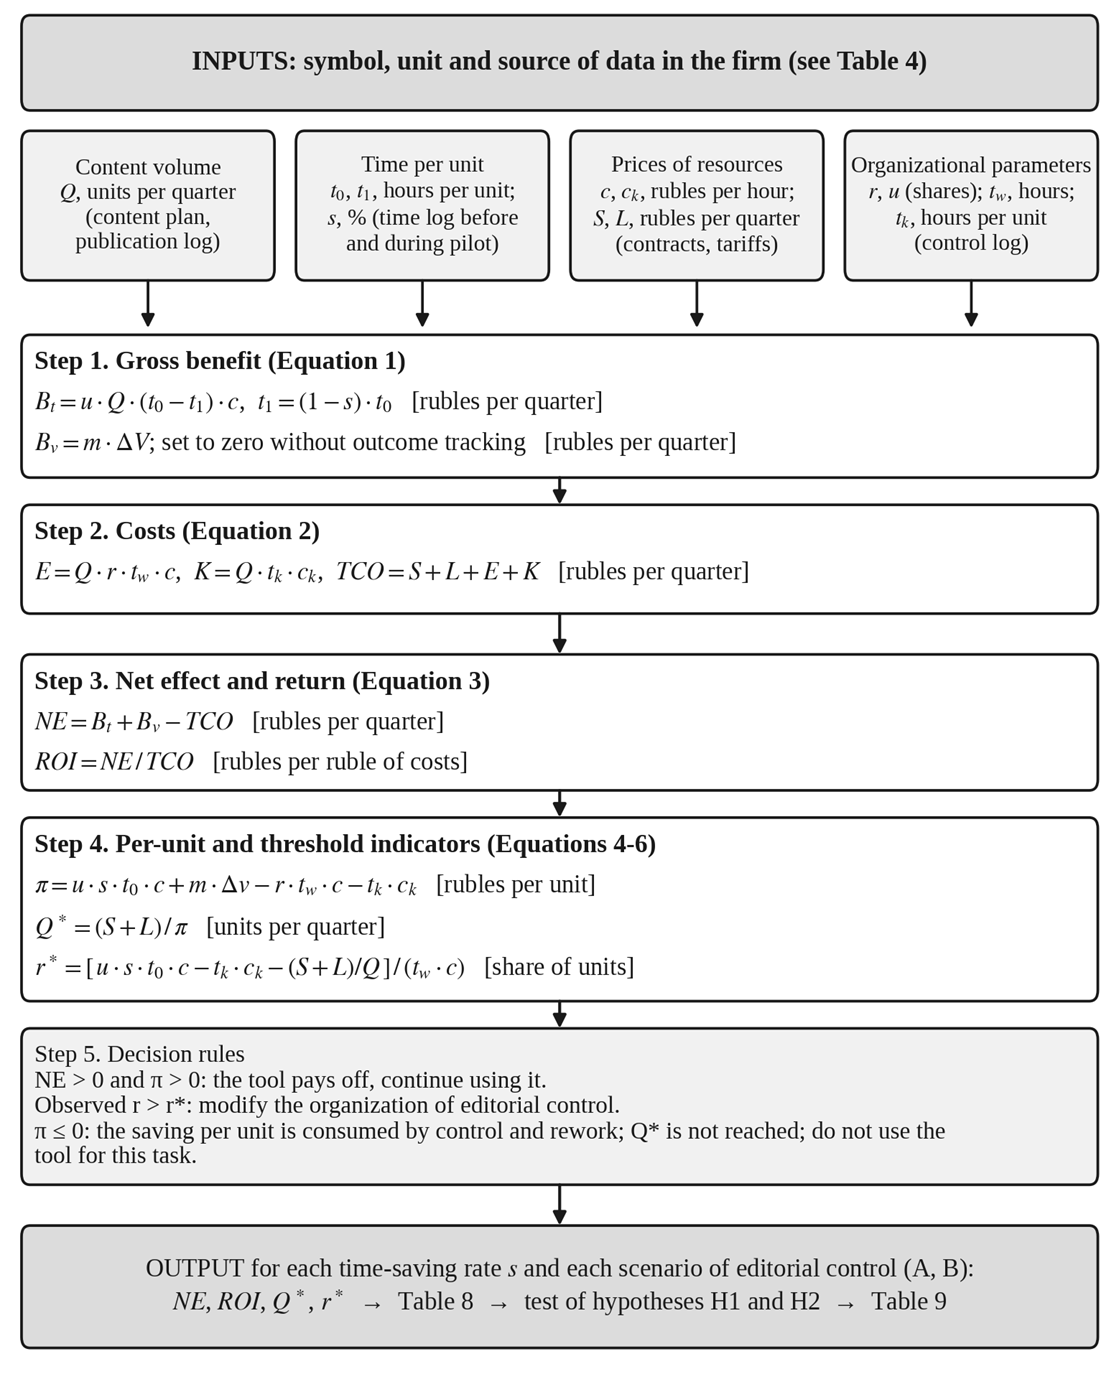
Figure 2. Algorithm of calculations: from the firm’s data to the decision rules
Source: compiled by the author based on Equations (1)-(6)
Scenarios of editorial control
In the model, organizational adoption is represented by parameters r, tw, tk, and part of L. Editorial control of generated content serves four purposes: ensuring factual accuracy (prices, product details, dates, claims), maintaining brand voice and positioning, complying with advertising and data regulations, and ensuring channel suitability. The distribution of these functions depends on firm size (Table 5). In micro-enterprises, the owner typically handles all control functions, making the owner’s time the main control resource and explaining why ck exceeds the performer’s rate.Table 5
Organization of editorial control of generated content in SMEs
|
Role in the process
|
Who
performs it in a micro-enterprise
|
Who
performs it in a small firm with a team
|
Functions
|
Model parameter (unit)
|
|
Operator
|
Owner or external copywriter
|
Content or social media specialist
|
Writes the brief and prompt, generates the draft,
performs first-pass editing against the checklist
|
t1 (hours
per unit)
|
|
Editor-controller
|
Owner
|
Head of marketing or senior editor
|
Checks facts, brand voice and legal compliance;
approves the unit or returns it for rework
|
tk (hours per unit), ck (rubles per
hour), r (share)
|
|
Owner of standards
|
Owner, with an external consultant if needed
|
Head of marketing
|
Develops and updates the brand voice guide, prompt
library and checklist; trains staff
|
L
(rubles per quarter)
|
Table 5 shows which role generates each group of costs in the model: the operator’s time is reflected in t1, the controller’s time and the share of returned units in tk, ck and r, and the development of standards in L.
Two scenarios of adoption were compared. In scenario A (use without a system), the tool is introduced without editorial standards. Drafts are checked occasionally (tk = 0.05 hours, about 3 minutes per unit), defects are often discovered after publication, and 40% of units require rework (r = 0.40), taking 1.5 hours each, including correcting published material and replying to the audience. The one-off training cost of 24,000 rubles (16 hours of the performer’s time) is apportioned over three quarters, the assumed period before skills and standards require substantial updating, so L = 8,000 rubles. In scenario B (editorial process), each unit is checked against a checklist (tk = 0.15 hours, about 9 minutes), most defects are corrected before publication, and the rework share falls to 10% with 1 hour per revision. The one-off costs also include 8 hours of the owner’s time to develop the brand voice guide, prompt library, and checklist, so L = (24,000 + 24,000) / 3 = 16,000 rubles per quarter. The parameters of both scenarios are summarized in Table 6.
Parameterization of the model
The model was parameterized for a simulated small online-expert business for one quarter. The content plan included Q = 80 units (48 social media posts, 12 newsletter issues, and 20 sales texts), with a baseline time t0 = 3.0 hours per unit; in practice, firms measure both of these values themselves. Time-saving rates were drawn from experimental studies: 13% as the lower bound (15% output increase in customer support [11], which is equivalent to a time saving of 1-1/1.15 ≈ 13%), 25% for tasks within AI’s capabilities in consulting [14], and 40% for professional writing tasks [24]. The central value of 25% was used as the base case. The performer’s cost c = 1,500 rubles per hour reflects an external copywriter, so u = 1; the controller’s cost ck = 3,000 rubles per hour reflects the owner or a senior marketer. The subscription S = 12,000 rubles per quarter covers two user licenses at 2,000 rubles per month each. Organizational parameters r, tw, tk, and L lack published SME marketing estimates, so scenario assumptions were used to describe two editorial control approaches, and threshold values (5) and (6) were calculated to avoid reliance on a single value. Bv was set to zero, so the estimate covers only measurable savings. Table 6 presents the values, units, and basis for all input parameters. Values not sourced from published studies are illustrative assumptions and are clearly indicated.Table 6
Input parameters of the simulated case
|
Parameter (symbol)
|
Unit
|
Scenario A
|
Scenario B
|
Basis of the value
|
|
Content units, Q
|
units per quarter
|
80
|
80
|
Illustrative content plan: 48 social media posts, 12
newsletter issues, 20 sales texts
|
|
Baseline time per unit, t0
|
hours per unit
|
3.0
|
3.0
|
Author’s illustrative assumption
|
|
Time-saving rate, s
|
% of t0
|
13 / 25 / 40
|
13 / 25 / 40
|
Published experiments: 13% [11]; 25% [14]; 40% [24]; base
case 25%
|
|
Performer’s hourly cost, c
|
rubles per hour
|
1,500
|
1,500
|
Author’s assumption: external copywriter
|
|
Share of released time with economic value, u
|
dimensionless
|
1
|
1
|
Hourly contractor; sensitivity check at u =
0.5 (see Results)
|
|
Controller’s time per unit, tk
|
hours per unit
|
0.05
|
0.15
|
Scenario assumption (about 3 and 9 minutes)
|
|
Controller’s hourly cost, ck
|
rubles per hour
|
3,000
|
3,000
|
Author’s assumption: owner or senior marketer
|
|
Share of units returned for rework, r
|
dimensionless
|
0.40
|
0.10
|
Scenario assumption
|
|
Time per revision, tw
|
hours
|
1.5
|
1.0
|
Scenario assumption
|
|
Subscriptions, S
|
rubles per quarter
|
12,000
|
12,000
|
Two licenses × 2,000 rubles per month × 3 months
(assumed tariff)
|
|
Training and standards, L
|
rubles per quarter
|
8,000
|
16,000
|
A: 24,000 rubles (16 h × 1,500) over 3 quarters; B:
(24,000 + 24,000 [8 h × 3,000]) over 3 quarters
|
|
Output gain, Bv
|
rubles per quarter
|
0
|
0
|
No outcome tracking
|
Operationalization of the hypotheses
The indicators and decision rules in Table 7 test the hypotheses formulated above. Because the study is model-based, we consider a hypothesis supported if its decision rule is met in the simulated case within the parameter ranges analyzed; this tests the model's logic and sensitivity, not a statistical test on a sample of firms.Table 7
Hypotheses, test indicators, and decision rules
|
Hypothesis
|
Test indicator (unit)
|
Decision rule
|
Data
|
|
H1: for a given s, the sign of the net effect
is determined by organizational conditions, particularly editorial control
|
NE in scenarios A and B at the same s (rubles per
quarter); threshold s at which NE = 0 in each scenario (%)
|
H1 is supported if there is an interval of s
within which NE < 0 in scenario A and NE > 0 in scenario
B
|
Table 8; Equations (1)-(3)
|
|
H2: time savings from experiments significantly
overstate the economic effect in SME practice
|
NE / Bt, % (in all scenarios and rates); NE
at u < 1 (rubles per quarter)
|
H2 is supported if the gross saving is at least
twice the net effect (NE ≤ 0.5 · Bt) in all cases analyzed;
the threshold of 50% is adopted in this study as the meaning of
“significantly”
|
Table 8; sensitivity calculations
|
Results
Table 8 presents the results of calculations by Equations (1)-(5) for three time-saving rates and two scenarios of editorial control.
Table 8
Net effect of adoption by time-saving rate and organizational scenario (rubles per quarter)
|
s, % [source]
|
Scenario
|
Bt, rub.
|
E, rub.
|
K, rub.
|
TCO, rub.
|
NE, rub.
|
ROI
|
NE / Bt,
%
|
Q*, units
|
|
13%
[11] |
A
|
46,800
|
72,000
|
12,000
|
104,000
|
−57,200
|
−0.55
|
−122
|
not reached
|
|
13%
[11] |
B
|
46,800
|
12,000
|
36,000
|
76,000
|
−29,200
|
−0.38
|
−62
|
not reached
|
|
25%
[14] |
A
|
90,000
|
72,000
|
12,000
|
104,000
|
−14,000
|
−0.13
|
−16
|
267
|
|
25%
[14] |
B
|
90,000
|
12,000
|
36,000
|
76,000
|
14,000
|
0.18
|
16
|
54
|
|
40%
[24] |
A
|
144,000
|
72,000
|
12,000
|
104,000
|
40,000
|
0.38
|
28
|
27
|
|
40%
[24] |
B
|
144,000
|
12,000
|
36,000
|
76,000
|
68,000
|
0.89
|
47
|
24
|
At the central time-saving rate of 25%, both scenarios yield the same gross saving (90,000 rubles per quarter), but net effects differ: scenario A results in a 14,000-ruble loss, while scenario B yields a 14,000-ruble gain (ROI = 0.18). This difference stems from the cost structure. In scenario A, rework absorbs 72,000 rubles (80% of gross savings); in scenario B, rework and control total 48,000 rubles. Assessing only resource savings and subscription cost would show a 78,000-ruble gain in both scenarios, overstating the effect in scenario B by over five times and misrepresenting scenario A. The break-even volume is 54 units in scenario B and 267 units in scenario A, over three times the content plan of 80 units. The maximum tolerable rework share is 22% in scenario B (assumed 10%) and 32% in scenario A (assumed 40%), so scenario B’s conclusion holds even if rework doubles.
At the boundary time-saving rates, the effect’s sign is independent of the scenario. At s = 13%, the saving per unit (585 rubles) is less than the per-unit cost of control and rework in scenario B (600 rubles), so adoption is not profitable at any volume. At s = 40%, both scenarios are profitable, but scenario B’s net effect is 1.7 times higher (68,000 vs. 40,000 rubles). The use of released time is also critical. If the performer is salaried and only half the released hours are redirected (u = 0.5), scenario B’s net effect becomes negative at both s = 25% (−31,000 rubles) and s = 40% (−4,000 rubles; break-even requires 94 units).
Results also depend on baseline time per unit, as control and rework costs are fixed in hours. At s = 25%, scenario B is profitable if t0 exceeds 2.5 hours per unit, while scenario A requires more than 3.5 hours. For short formats with low baseline time, control costs are harder to recover.
Hypothesis H1 (for a given time-saving rate, the sign of the net effect is determined by organizational conditions, particularly editorial control; decision rule in Table 7) is supported for the central time-saving range. With base parameter values, scenario B yields a positive net effect when s exceeds 21%, and scenario A only when s exceeds 29%. Within this interval, which includes the central estimate of 25%, editorial control determines the effect’s sign. Outside this range, the task-specific time-saving rate determines the sign, while organizational factors affect the magnitude. Hypothesis H2 (time savings from experiments significantly overstate the economic effect in SME practice; decision rule in Table 7) is also supported: in all cases, the net effect is less than half the gross saving (maximum 47%), and when u < 1, it may disappear entirely. The results of testing are summarized in Table 9; both hypotheses are supported only within the simulated case and the parameter ranges analyzed.
Table 9
Results of testing the hypotheses (simulated case)
|
Hypothesis
|
Observed values
|
Decision
|
Interpretation
|
|
H1
|
At s = 25%: NE =
−14,000 rubles per quarter (A) and +14,000 (B); threshold s at which NE = 0:
29% (A) and 21% (B); the interval 21–29% includes 25%
|
Supported
|
Within the interval 21-29%, editorial control
determines the sign of the effect; outside it, the sign is determined by the
time-saving rate
|
|
H2
|
NE / Bt ranges
from −122% to 47% (maximum: scenario B, s = 40%); in scenario B at u
= 0.5, NE = −31,000 (s = 25%)
and −4,000 rubles per quarter (s = 40%)
|
Supported
|
The net effect never exceeds 47% of the gross
saving; at u < 1 it may disappear
|
Discussion
The results are consistent with the view that complementary organizational investments, rather than the technology alone, create the value of digital technology [10; 23]. In the model, the brand voice guide, the prompt library, the checklist, and the controller’s time serve as complementary assets: they increase L and K but reduce E by a larger amount. The experiments’ time measurements do not capture the costs of building them, which explains why experimental savings cannot be transferred directly to practice and aligns with the J-curve argument [12]. The finding that a human editor is indispensable in content marketing [26] and the emergence of reviewing and correcting AI-generated content as a new job task [21] show that E and K reflect real changes in work rather than a modeling convention. The survey figure of nearly 40% of SMEs without measurable results [17] is consistent with scenario A, in which gross savings are real but consumed by rework. Barriers identified in Russian studies, such as low trust, insufficient competencies, and organizational resistance [8; 9], are expressed in the model through L and r.
Four organizational factors distinguish effective from ineffective adoption in the model. The first is editorial control, which determines r and tw. The second is the use of released time (u): released hours create value only if they are unpaid or spent on higher-value tasks, such as client work or product development. The third is competence: training is part of L, and without it the achieved time-saving rate is lower, since the gains from generative assistance depend on the user’s experience [11]. The fourth is the choice of tasks: within the frontier of AI capabilities, time savings are high, whereas outside it the tool can worsen results [14]; for this reason, the model excludes strategic and relational tasks (Table 2). The available surveys report the share of firms using generative tools rather than the share of marketing work performed with them; in the model, this share is captured through Q, the volume of content actually produced with the tool, while the potential estimated for the marketing function as a whole [13] sets an upper boundary for expectations.
For practical application, the following procedure is recommended (it follows the algorithm in Figure 2). First, the firm should record the number of content units and the time spent on them for four to six weeks prior to adoption. Second, during a one- to two-month pilot, it should record t1, the share and duration of rework, and the controller’s time. Third, NE, ROI, Q*, and r* are calculated using Equations (1)-(6). Fourth, the firm determines whether to continue, modify the organization of control (if the observed r exceeds r*), or discontinue use of the tool for tasks where the saving per unit does not offset the costs of control. All data can be maintained in a spreadsheet without specialized analytical software.
The study has limitations. Parameterization is illustrative: time-saving rates are based on experiments with English-language tasks and specific samples, and organizational parameters are scenario assumptions. The study uses only secondary data and a simulated case, so the model supports hypotheses H1 and H2, and the parameter ranges analyzed require testing on primary data from SMEs; the author’s consulting experience was used only to structure the process and is not a data source. Reputational losses from published errors are not monetized, so losses in scenario A are underestimated. Output gain is excluded, making the estimate conservative for firms that track outcomes. The model covers one period without discounting, which is suitable for subscription tools with short payback periods but not for large one-off investments.
Conclusion
This study proposes a method for assessing the economic effect of adopting generative AI tools in SME marketing using firm-available data. The gap between widespread adoption and the lack of measurable results is framed as a measurement issue: experimental time savings are counted as economic effects, while control, rework, and use of released time are often excluded.
The proposed model combines three established approaches, each insufficient alone for small firms, and links every element to a measurable content-production parameter. Key features include explicit editorial control, a break-even volume that accounts for variable costs, and the maximum tolerable rework share.
Parameterization of the model with time-saving rates from published experimental studies shows that at a central time-saving rate of 25%, the tool results in a quarterly loss without systematic editorial control and a positive net effect with an established editorial process. Hypotheses H1 and H2 are supported in the simulated case. At a low time-saving rate of 13%, adoption is not profitable at any volume, and if released time is only partly used, the effect becomes negative even with editorial control. The economic effect of generative tools in SME marketing depends on organizational structure, especially editorial control and use of released time, within task-specific limits. Further research should test the model on primary data from SMEs (time logs, records of rework and control) across sectors and languages, directly measure rework share and control time, and include output gains for firms that track marketing outcomes.
Страница обновлена: 09.11.2026 в 13:45:41
Economic assessment of the effect of adopting generative artificial intelligence tools in the marketing of small and medium-sized businesses
Seredinskaia D.S.Journal paper
Marketing and marketing research
Volume 32, Number 1 (January-March 2027)