France’s national strategy in the global nuclear power plant construction market
Горемышев А.В.1 ![]() , Капусткин В.И.1
, Капусткин В.И.1 ![]()
1 Санкт-Петербургский государственный университет, Санкт-Петербург, Россия
Скачать PDF | Загрузок: 14
Статья в журнале
Экономика, предпринимательство и право (РИНЦ, ВАК)
опубликовать статью | оформить подписку
Том 16, Номер 4 (Апрель 2026)
Эта статья проиндексирована РИНЦ, см. https://elibrary.ru/item.asp?id=91230209
Аннотация:
В условиях структурных изменений мировой энергетики и усиления требований к декарбонизации развитая атомная энергетика вновь становится звеном энергетической конкурентоспособности стран в мировой экономике. Франция – один из исторических лидеров отрасли – одновременно обладает преимуществами развитой национальной атомной инфраструктуры и сталкивается с ограничениями в реализации проектов нового поколения. В статье предложена экономико-математическая модель национальной стратегии Франции на мировом рынке сооружения атомных электростанций, основанная на сравнительном анализе с ключевыми странами-конкурентами. Выполнена расчетная апробация модели с использованием индикаторов серийности строительства, управляемости проектов и показателем приведённой стоимости электроэнергии (Levelized Cost of Electricity, LCOE). Полученные результаты позволили обосновать направление трансформации французской стратегии на базе эффекта обучения и управляемости портфеля.
Ключевые слова: атомная энергетика, мировая экономика, международный бизнес, мировой рынок, строительство атомных электростанций, национальная стратегия, конкурентоспособность, показатель приведённой стоимости электроэнергии, LCOE, международный бизнес, АЭС
JEL-классификация: P28, O13, Q47, F23
Introduction
Global energy system in the mid-2020s is developing under the influence of technological, macroeconomic and institutional factors. On the one hand, the electrification of industry and transport is increasing, the demand for reliable capacities for digital economy and data centers is growing, the need for managed power generation, which should be capable of ensuring the stability of power systems with an increase in the segment of renewable sources is increasing. On the other hand, tightening of the climate agenda and focusing on the reduction of greenhouse gas emissions increase the value of low-carbon energy sources not only as a component of national energy policy, but also as an instrument of international competitiveness and industrial policy in the global economy [15]. In this logic, nuclear power becomes a strategic sector again: it provides scalable carbon-free generation, forms long value chains and supports the export of high-tech services and equipment [15, 22].
The renewed interest in nuclear power is accompanied by a change in the structure of global nuclear power plant (NPP) construction market. There is a concentration of competencies and contracts in a limited number of countries, which supply technologies and engineering solutions. The role of state as a guarantor of financing and risk management is strengthened. The importance of “non-monetary” factors is increasing, namely: reputation, safety standards, personnel and production base, as well as capability to implement the projects in series [22, 14]. These processes increase the competition between national atomic “systems”, where the country’s strategy is determined not only by the reactor characteristics, but also by the ability to create an international business of integrated engineering companies: from design, procurement and construction (EPC: Engineering, Procurement and Construction) to operation, service support and, in some cases, services with regard to the nuclear fuel cycle stages (fuel production, spent nuclear fuel processing and nuclear material handling), as well as the formation of corresponding nuclear infrastructure [20].
The above changes stipulate the relevance of this study, since France is a historical “reference standard” of national atomic model. At the same time, it shows the vulnerabilities in the transition to projects of Generation III+ (Generation III Plus includes Generation III+ reactors, which are an upgraded version of Generation III reactors designed with regard to the requirements of increased safety, resistance to severe accidents and extended service life).
The France’s industry was formed based on centralized system of national administration and serial construction during the implementation of Messmer Plan, which ensured rapid growth of installed capacity and subsequent dominance of nuclear generation in the country electric power balance [26, 3]. At the same time, the experience in implementation of European Pressurized Reactor (EPR) projects revealed the problems of institutional manageability of projects and loss of learning effect, which affects the construction timeframes and specific costs and, therefore, the competitiveness in the global market [22, 24].
In the modern scientific literature, several areas of research can be distinguished. The first area is related to assessment of the nuclear energy role in the global power generating system and the relationship of nuclear generation with sustainable development and macroeconomic dynamics. These issues are investigated both in international analytical publications [15] and in scientific works, including researches on the atomic energy role in the global energy balance and trends in its development: Goremyshev A.V., Kapustkin V.I. [13, 2019. P. 57–67; 1, 2025. P. 5597-5618; 12, 2025. P. 7145-7168], Mirsiyapov I. I. [2, 2009], Cherkasenko A.I. [5, 2008. P. 40-44], Selyutin S.V. [3, 2014, P. 200], Cherp A., Jewell J., Goldtau A. [7, 2011. P. 75-88], Christian von Hirschhausen, Kemfert K. [8, 2025. P. 135].
The second area is related to the nuclear generation economy, assessment of capital costs, risks of uncertainty and levelized cost of electricity (LCOE). A number of studies have shown that LCOE is sensitive not only to the reactor design features, but also to the discounting rate, construction timing and learning effect: Thomas S. [24, 2018, P. 185-192], Lovering J., Yip A., Nordhaus T. [17, 2016, P. 371-382], Rothwell J. [21, 2022. P. 112905],Agar A.S., Locatelli G. [6, 2020. P. 161-186], analytical publications [19, 25, 9].
The third area focuses on the competitiveness of countries in the global NPP construction market and on the institutional export models. The works emphasize that sustainable leadership is formed through serial pattern and portfolio scale, availability of financial mechanisms, maturity of supply chains and project management: analytical reports [22, 14, 16], Nakano J. [18, 2020], Scholten D. [23, 2024], Yildyz E.K. [27, 2025], Fedosova Yu.V. [4, 2006].
At the same time, systematized works formalizing the France’s strategy in the global NPP construction market through a quantitative model and international comparison are not sufficiently presented, which determines the scientific novelty of this study.
In this article, the authors establish a goal to form an economic and mathematical model of the France’s national strategy in the global NPP construction market and to develop a strategy based on this model through a comparative analysis with key competitor countries.
The scientific novelty of the study consists in the development of the strategy feasibility cumulative index, which unites the project portfolio scale, serial pattern / learning effect, institutional manageability of projects and LCOE indicator within a single formalization suitable for comparing the countries.
The study is based on an analysis of two main hypotheses. The first hypothesis of the study states that the competitiveness of France in the global NPP construction market is determined mainly by institutional factors, namely: serial pattern of construction (α), manageability of projects (β) and stability of organizational model, and not only by the reactor plant technological level. The second hypothesis is that LCOE indicator showing the total levelized costs of electricity, is a key criterion of the national strategy implementation efficiency and a means of transforming institutional advantages into market result.
The research methodology includes systematic and comparative analysis, economic and statistical methods, and economic and mathematical modeling. The empirical base is formed from reports of international organizations, industry statistics and corporate reporting data, as well as scientific publications on the nuclear energy economy and the competitiveness of countries in the NPP construction market [15, 22, 20, 17].
Historic Basis and Institutional Architecture of the France’s Atomic Strategy
The nuclear industry of France is based on a long-standing national policy focused on energy sovereignty and industrial development. Key feature of the France’s model is the early institutionalization of the industry and the centralized coordination of state, operator and supply chain. The most important accelerator was the oil turbulence in the 1970s, after which France decided to launch a large-scale nuclear program, which went down in history as Messmer Plan [26, 3].
Table 1
Main milestones of the France’s nuclear industry formation
|
Period
|
Key event
|
Economic and institutional result
|
|
1945–1958
|
Institutionalization of atomic policy (scientific
base and national administration of the industry)
|
Formation of national competence and key personnel
|
|
1960–1973
|
Development of commercial nuclear generation
|
Gaining of operational experience and
standardization of processes
|
|
1974–1988
|
Implementation of the Messmer Plan (serial program)
|
Rapid growth of capacities, learning effect, reduced
fuel import dependency
|
|
1990–2005
|
Consolidation of nuclear power plant fleet and
optimization of operation
|
Reduced specific operating costs and increased asset
management efficiency
|
|
2006–2015
|
Transition to Generation III+ projects (EPR)
|
Increase of project complexity, strengthening of supply
chain and manageability requirements
|
|
2016–present
|
Strategy adjustment (EPR2, attempt to standardize)
|
Return to serial pattern and portfolio manageability
logic
|
The table shows that the greatest strategic effect for France was provided by the period of serial construction as part of the Messmer Plan, when the industry received a sustainable institutional architecture and a learning effect. On the contrary, the transition to more complex new generation projects was accompanied by increase of the requirements for project management and supply chains, which created the prerequisites for revising the strategy in favor of standardization.
In terms of global economy, the France’s nuclear industry is important for two reasons. First, it is a source of stable low-carbon electric energy, creating competitive advantages for the industry and the export of energy-intensive products. Secondly, the industry forms a high-tech international business: export of engineering services and equipment, participation in foreign projects involving the NPP construction and operation [15, 22].
The France’s model of international business in the nuclear power includes the NPP design, construction and operation, as well as certain stages of nuclear fuel cycle, namely: nuclear fuel production, spent nuclear fuel processing and nuclear material handling [20]. This ensures long contract relationships and high market connectivity, which is typical for “large project” industries and infrastructure.
Key members of the France cooperation are:
EDF (Électricité de France) as an operator and system integrator responsible for the nuclear fleet operation and development and for large investment programs [10];
Framatome as a provider of nuclear island solutions, fuel and services during the NPP life cycle [11];
Orano as a nuclear fuel cycle actor (front end and back end), including spent fuel processing and material handling services [20];
large cooperation companies and companies of related competencies: Assystem (engineering and consulting services), Bouygues, Vinci, Eiffage (construction and infrastructure competencies), and supply chains for metallurgy, mechanical and instrumentation engineering (within the national industrial base).
Institutional Determinants of Competitiveness: Quantitative Verification of Model
The first hypothesis of the study states that the competitiveness of France in the global NPP construction market is determined mainly by institutional factors, namely: serial construction (α), manageability of projects (β) and stability of organizational model, and not only by the reactor plant technological level. For verification of this hypothesis, it is necessary to eliminate the possible influence of technology factor and to analyze the countries with a comparable level of reactor solutions. In other words, if differences in the competitiveness are observed within the same technological class, then their source is institutional and not technological parameters.
1. Comparability of Technological Class
For empirical verification of the first hypothesis, it is necessary to quantify the institutional parameters of implementation of Generation III+ projects in the countries that are key participants in the global NPP construction market. In the considered countries, Generation III+ reactors with similar safety and performance requirements are used (EPR in France, VVER-1200 in Russia, HPR1000 in China, APR-1400 in the Republic of Korea). Therefore, the technology class is comparable and it does not explain the radical differences in market positions. In this regard, it is reasonable to carry out a comparative analysis by the indicators of average construction duration (T), serial coefficient and learning effect (α), and design implementation manageability (β). In addition, LCOE indicator is given at a discount rate of 7 % reflecting the economic consequence of organizational parameters. Systematization of these data is presented in Table 2.
Table 2
Institutional parameters of the countries competitiveness in the global NPP construction market (Generation III+ projects)
|
Country
|
Average construction duration T, years
|
Serial pattern / learning effect α
|
Project manageability β
|
LCOE (7 %), $/MWh
|
|
France
|
17.1
|
0.29
|
0.50
|
71.1
|
|
Russia
|
16.2
|
0.35
|
0.70
|
42.0
|
|
China
|
6.3
|
1.00
|
0.98
|
66.0
|
|
The
Republic of Korea
|
8.7
|
0.84
|
0.67
|
53.3
|
Source: [19, 22], the author’s calculations.
The data in Table 2 demonstrate a significant differentiation of institutional parameters with a comparable technology class of Generation III+ reactors. The smallest average construction duration was recorded in China (6.3 years), which corresponds to the maximum serial coefficient value (α = 1.00). France is characterized by the longest project implementation period (17.1 years), which is shown in the minimum value of α (0.29). A similar trend is observed for the manageability indicator: China shows almost the highest value of β (0.98), while for France, it is 0.50. Despite the technological comparability of projects, the differences in institutional parameters are significant.
Thus, the differences in the competitiveness of countries cannot be explained by the technological factor, since the considered reactors are of the same Generation III+. The main differences are formed in the institutional plane: through serial pattern, manageability and project implementation period.
2. Empirical Differences in Institutional Parameters
Based on the data given in Table 2, despite the comparable process class:
· For China, index S is about 66 times higher than for France;
· For Russia, index S is about 20 times higher;
· For the Republic of Korea, index S is 6 times higher.
The differences in LCOE partially explain the gap, however, the differences in T, α and β remain the key factors.
3. Mathematical Confirmation by the Model
The strategy index is determined as:
![]()
where:
|
|
is the integral index of strategy in the NPP
construction market;
|
|
|
is the scale of the implemented projects portfolio,
which forms the quantitative basis for national strategy competitiveness (in
the calculations, it is GW);
|
|
|
is serial coefficient and learning effect (0...1);
|
|
|
is institutional manageability coefficient of
projects (0...1);
|
|
|
is levelized cost of electricity (LCOE), $/MWh;
|
For France:
![]()
In case of a hypothetical increase in institutional parameters to a moderate level (without changing the reactor and LCOE):
![]()
![]()
The growth by more than 3 times is achieved solely due to institutional factors.
4. Historical Retrospective
During the Messmer Plan period, an average construction duration in France was 6–7 years [22, 26], which corresponds to:
![]()
During this period France formed a scalable model and took a stable position in the global nuclear industry. The modern gap with China and Russia arises not because of the technology, but because of loss of serial pattern and increased project delays.
The comparison of countries with the same Generation III+ reactor technology class shows that the differences in competitiveness mainly arise from institutional parameters (α, β) affecting the construction time frames and LCOE. Mathematical structure of the model confirms increasing influence of α and β on the strategy index. Therefore, the first hypothesis gets the empirical and formal confirmation.
Formulation and Model of the France’s National Strategy
Based on the information and data given above, as well as on the data [17, 19], the France’s strategy in the global NPP construction market is formulated as follows: the France’s national strategy in the global nuclear power plant construction market is a strategy of institutionally controlled scaling of Generation III+ reactor product line with the priority of restoring serial pattern of construction, increasing project manageability and reducing levelized cost of electricity in order to maximize the integral index of strategy feasibility and strengthen the competitive positions in the global nuclear industry.
Formula (1) is a mathematical model of the France’s national strategy
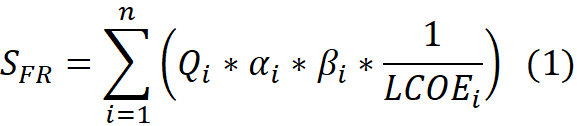
where:
|
|
is an integral index of implementation of the
France’s national strategy at the NPP construction market;
|
|
|
is the scale of portfolio of implemented projects
for product i, which forms the quantitative basis for the national strategy
competitiveness (in the calculations, it is GW);
|
|
|
is serialization coefficient and learning effect
(0...1);
|
|
|
is institutional manageability coefficient of
projects (0...1);
|
|
|
is levelized cost of electricity (LCOE), $/MWh;
|
|
|
is product segments (Generation III+ high power
NPPs, small modular reactors (SMR), etc.).
|
· a market share;
· a measure of profit or revenue;
· a direct cost-effectiveness assessment of an individual project.
Index ![]() should
be interpreted as a comprehensive measure of the France’s capability to
transform the existing project portfolio, institutional advantages and economic
parameters into a sustainable presence in the global NPP construction market.
should
be interpreted as a comprehensive measure of the France’s capability to
transform the existing project portfolio, institutional advantages and economic
parameters into a sustainable presence in the global NPP construction market.
It should be noted that taking into account the used model structure and actual parameters of the global NPP construction market, practical range of index S values is limited to the following intervals:
![]()
where:
· the lower bound S = 0 corresponds to the absence of active strategic market presence;
· the upper bound of 0.5– 0.6 corresponds to the maximum implementable strategy with a combination of large project portfolio, high serial pattern and competitive LCOE (these are observed in the leading countries).
Values above 0.6 in the current market configuration are practically inaccessible, since they require an extremely large project portfolio, ideal serial pattern, and minimum costs at the same time, which is not observed empirically.
Brief conclusion of the chapter may be based on the counter-argument that the problems of France are mainly related to the “technological complexity” of EPR projects. However, comparative studies show that a key reason for the cost increase and the terms extension is directly the institutional environment of project implementation (serial pattern, supply chains, management), that is the “method of production” of projects and not just the reactor “design” [15, 17]. Therefore, the strategy adjustment has to focus on the portfolio manageability and learning effect, which is reflected in the model (1).
Design Testing of the Model, Comparison with the Competitors
This chapter provides quantitative testing of the developed model of the France’s national strategy based on comparable international data. The integrated strategy index is calculated taking into account the project portfolio scale, serial pattern of construction, institutional manageability of projects and LCOE indicator. After that, this index is compared with the results of competing countries. This allows for empirical testing of the second hypothesis of the study.
For comparability of the competing countries, the following are used:
· data on the average duration of power unit construction (in 2015–2024) [22];
· data on the share of projects falling behind the construction schedule [22];
· assessment of LCOE of new NPPs at a discount rate of 7 % based on OECD/IEA/NEA bases presented in the industry review [19];
· portfolio of active construction projects with regard to the country providing the technology at the date of 01.06.2025 [22].
The calculation model is given stepwise.
In the demonstration area, the dominant product is considered: Generation III+ high power nuclear power plants.
Step 1. Calculation of portfolio scale Q (GW).
According to the report WNISR2025, France has two EPR power units under construction in the UK as a technology supplier [22]. Taking the power of 1 power unit as 1.63 GW, we have:
![]() [22]
[22]
Step 2. Calculation of serial coefficient α.
WNISR2025 shows the average duration of NPP construction (in 2015– 2024) as follows: 17.1 for France, 6.3 for China, 8.7 for the Republic of Korea, 16.2 for Russia, 21.5 for the USA [22].
Since a shorter construction duration corresponds to a higher efficiency, the inverted linear normalization is used
![]() ,
,
where ![]() [22].
[22].
For France:
![]() [22]
[22]
Step 3. Calculation of
manageability coefficient ![]() .
.
WNISR2025 report for France as a supplier states that both of the foreign projects “fall behind the schedule” (2 of 2) [22]. The proportion of is delay is δ=1.
![]() [15]
[15]
Step 4. Select LCOE ($/MWh).
For
France with 7 %
![]() =71.1
$/MWh [19]
=71.1
$/MWh [19]
Step 5. Final strategy index of France.
![]() [22.19].
[22.19].
The numerical value of 0.0066 means that the actual contribution of France into the formation of the global NPP construction market structure is minimal, despite the availability of developed technological and engineering competencies. This index indicates a significant gap between the potential capabilities of the France’s nuclear industry and their practical implementation in international projects. It is important to emphasize that such a low index value does not indicate the technological underdevelopment of France. On the contrary, it shows the limited institutional and organizational feasibility of the strategy expressed in a small construction portfolio scale, low serial pattern of projects and problems with the construction schedule manageability.
Calculation of International Index S and Strategy Comparison Table
For Russia, China and the Republic of Korea, indicator Q is determined as the construction project portfolio of the technology supplier (according to WNISR 2025) multiplied by the standard power of a unit (in the demonstration assessment: 1.20 GW for Russia; 1.161 GW for China; 1.40 GW for the Republic of Korea) [22].
Table 3
Comparison of strategies of competing countries in the NPP construction market (Generation III+ projects)
|
Index
|
France (EPR/EPR2 as Generation III+ line)
|
Russia (VVER-1200)
|
China (HPR1000)
|
The Republic of Korea (APR-1400)
|
USA (AP1000)
|
|
Active
construction portfolio of a supplier, GW, Q
|
3.26
|
32.40
|
33.67
|
4.20
|
0
|
|
Average
construction duration, years, T
|
17.1
|
16.2
|
6.3
|
8.7
|
21.5
|
|
Serial
pattern / Learning, α
|
0.29
|
0.35
|
1.00
|
0.84
|
0.00
|
|
Manageability,
β
|
0.50
|
0.70
|
0.97
|
0.60
|
1.00
|
|
LCOE
with 7 %, $/MWh
|
71.1
|
42.0
|
66.0
|
53.3
|
71.3
|
|
Strategy
index, S
|
0.0066
|
0.141
|
0.438
|
0.042
|
0.0000
|
In Table 3, values α and β are calculated as per the same rules based on WNISR2025 [22]. LCOE values are given as per the OECD/IEA/NEA agency study [19]. The authors do not intend to provide the calculations of the index and its components for the competing countries, they provide only the results of these calculations. An interested reader may check the calculations based on the sources provided by the authors.
Table 3 shows significant differences between the countries in strategy feasibility in the NPP construction market. China has the highest value of index S due to the largest construction project portfolio and the minimum construction timing, providing a high serial coefficient. Russia takes the second place due to its significant project portfolio and low LCOE. The Republic of Korea has a moderate index with a relatively small portfolio. France is characterized by a low value of S due to long implementation timing and high sensitivity to schedule manageability. The United States has a zero index value due to the lack of active portfolio of construction projects at the date under review. (Calculation sources: WNISR 2025 and OECD/IEA/NEA) [22, 19].
Thus, the obtained values of integrated strategy index demonstrate that the differences in the positions of countries in the global NPP construction market result only from the project portfolio scope, but also from the combined influence of institutional, technological and management factors. In particular, the high position of Russia is determined by the scale of serial construction and the relative stability of price parameters. While the low value of the France’s index reflects structural restrictions associated with protracted period of project implementation and capital cost increase. These differences form the prerequisites for an in-depth analysis of economic determinants of the national strategy implementation, among which the LCOE indicator is a key. It allows for comparison of the project competitiveness in comparable technological and market conditions.
The second hypothesis suggests that
LCOE is a key criterion for strategy implementation. The calculations show that
with comparable technology classes of Generation III+ reactors, the differences
in the level of LCOE remain significant: in particular, with the discount rate
of 7 %, LCOE for Russia is 42.0 $/MWh, while for France, it is 71.1 $/MWh
[19]. A higher LCOE value results in a lower value of component ![]() in
formula (1), which, in turn, reduces the final strategy index and degrades the
price competitiveness of the French model in the global NPP construction market
[19]. At the same time, the NPP construction economy studies show that LCOE is
sensitive to the construction timing and the learning effect (serial pattern),
which means that institutional parameters α and
β are a channel of influence on the final
economic result [17; 19]. Therefore, the second hypothesis is confirmed.
in
formula (1), which, in turn, reduces the final strategy index and degrades the
price competitiveness of the French model in the global NPP construction market
[19]. At the same time, the NPP construction economy studies show that LCOE is
sensitive to the construction timing and the learning effect (serial pattern),
which means that institutional parameters α and
β are a channel of influence on the final
economic result [17; 19]. Therefore, the second hypothesis is confirmed.
Based on the results of design testing of the model of France’s national strategy in the global NPP construction market, it was determined that the country’s current strategic positioning is characterized by low feasibility in the mid-term perspective. The obtained value of the strategy integral index shows structural limitations of the France’s model, primarily related to long-term implementation of projects, limited serial construction and high sensitivity to the manageability of project schedules.
As the main counterargument, it can be stated that the revealed gap between France and its key competitors is temporary and will be overcome as part of a new state program for the development of nuclear energy, including implementation of EPR2 projects and expansion of export portfolio. However, the modeling results indicate that the project portfolio increase itself does not result in a proportional increase in strategic feasibility.
Model (1) shows that the integral strategy indicator is a multiplicative function of the portfolio scope, serial pattern, and learning effect, as well as the coefficient of manageability and institutional stability. When values α and remain low, the increase of indicatoris accompanied by the diminishing returns effect: the increase of quantitative indicators does not compensate for institutional and technological limitations. This means that if the current parameters of project implementation remain constant, the France’s strategic position remains vulnerable even with a formal expansion of product line. It should also be noted that empirical data on the construction timing and capital cost dynamics confirm the high elasticity of LCOE with regard to the project cycle manageability. Delays in the commissioning of capacities and deviations from initial schedules result in an increase of levelized cost of electricity, which reduces the price competitiveness of the France’s projects in the foreign markets compared to serial programs of China, the Republic of Korea and Russia [24, 17, 19].
Conclusion
Thus, the transformation of the France’s national strategy cannot be narrowed down solely to scaling up the construction. The key direction of strategic change has to be the institutional and technological restructuring of the project implementation model focused on standardization of project solutions, creating sustainable serial pattern of construction and strengthening of supply chains. These particular components ensure the growth of coefficients and, reducing LCOE and, as a result, increasing strategic feasibility of the French model in the global NPP construction market.
The study showed that the France’s national strategy in the global NPP construction market is determined not only by the technological level of Generation III+ projects, but also by the institutional factors: serial pattern of construction, project area manageability and ability to reduce LCOE. The developed economic and mathematical model allowed for moving from descriptive analysis to quantitative estimate of the strategy feasibility and comparison with the key competitors.
The design testing showed that France is inferior to China and Russia in the strategy index due to the long construction timing and high sensitivity to schedule disruption, which is reflected in higher LCOE. Thus, both hypotheses are confirmed: institutional efficiency is the determining factor of competitiveness and LCOE is the key criterion for the strategy implementation. Practical conclusion is the need to restore the learning effect through standardization, serial pattern, and strengthening of supply chains, which has to be the basis of a renewed French strategy in the nuclear engineering market.
Источники:
2. Мирсияпов И.И. Международная конкурентоспособность российской атомной энергетики. / Дисс... канд. экономич. наук. - М., 2009. – 169 c.
3. Селютин С.В. Современные тенденции развития мировой атомной энергетики. / Диссертация на соискание ученой степени кандидата экономических наук. - Москва, 2014. – 200 c.
4. Федосова Ю.В. Формирование национальных стратегий на мировом рынке сооружения АЭС. / Дисс... канд. экономич. наук. - Санкт-Петербург, 2006. – 250 c.
5. Черкасенко А.И. Анализ современного состояния атомной отрасли Российской Федерации // Экономические науки. – 2008. – № 45. – c. 40-44.
6. Agar A. S., Locatelli G. Economics of nuclear power plants. / In book:Nuclear Reactor Technology Development and Utilization. - Sawston, Cambridge: Woodhead Publishing, 2020. – 26 p.
7. Cherp A., Jewell J., Goldthau A. Governing global energy: systems, transitions, complexity // Global Policy. – 2011. – № 1. – p. 75-88. – doi: 10.1111/j.1758-5899.2010.00059.x.
8. Christian von Hirschhausen C., Kemfert C. Nuclear Power and Geopolitical. / In book: Nuclear Power: Technology, Geopolitics, and Economics. - Cham: Springer, 2025. – 135-151 p.
9. Half-year results 2025 (press release). EDF. [Электронный ресурс]. URL: https://www.edf.fr/ (дата обращения: 04.03.2025).
10. 2025 half-year results (financial highlights). EDF. [Электронный ресурс]. URL: https://www.edf.fr/ (дата обращения: 04.03.2025).
11. Company information and publications. Framatome. [Электронный ресурс]. URL: https://www.framatome.com/ (дата обращения: 28.03.2025).
12. Goremyshev A.V. Assessment of position of the People’s Republic of China in the world nuclear power plants’ construction market // Journal of Economics, Entrepreneurship and Law. – 2025. – № 10. – p. 7145-7168. – doi: 10.18334/epp.15.10.123834.
13. Goremyshev A., Kapustkin V. World nuclear energy development trends and Russia’s competitiveness at the global nuclear market // The Third International Economic Symposium (IES 2018): Сер. «Advances in Economics, Business and Management Research» Том 104. St. Petersburg, 2019. – p. 448-458.
14. Nuclear Power Reactors in the World. Reference Data Series No. 2. International Atomic Energy Agency. [Электронный ресурс]. URL: https://www.iaea.org/publications (дата обращения: 17.03.2025).
15. World Energy Outlook 2023. International Energy Agency. [Электронный ресурс]. URL: https://www.iea.org/reports/world-energy-outlook-2023 (дата обращения: 17.03.2025).
16. Levelized Cost of Energy (LCOE). Lazard. [Электронный ресурс]. URL: https://www.lazard.com/ (дата обращения: 04.03.2025).
17. Historical construction costs of global nuclear power reactors // Energy Policy. – 2016. – p. 371-382. – doi: 10.1016/j.enpol.2016.01.011.
18. Nakano J. The Changing Geopolitics of Nuclear Energy. / A Look at the United States, Russia, and China. - Washington, D.C.: Center for Strategic and International Studies, 2020. – 43 p.
19. Projected Costs of Generating Electricity 2020. - Paris: OECD Publishing, 2020.
20. Annual Activity Report 2024. Orano. [Электронный ресурс]. URL: https://www.orano.group/ (дата обращения: 09.04.2025).
21. Rothwell G. Projected electricity costs in international nuclear power markets // Energy Policy. – 2022. – p. 112905. – doi: 10.1016/j.enpol.2022.112905.
22. Schneider M., Froggatt A., Hazemann J. et al. World Nuclear Industry Status Report 2025. Worldnuclearreport.org. [Электронный ресурс]. URL: https://www.worldnuclearreport.org/ (дата обращения: 28.03.2025).
23. Scholten D. The Power of Energy: The Geopolitics of the Energy Transition // E-International Relations. – 2024.
24. Thomas S. The economics of nuclear power: An update // Energy Policy. – 2018. – p. 185-192.
25. Economics of Nuclear Power. World Nuclear Association. [Электронный ресурс]. URL: https://world-nuclear.org/ (дата обращения: 04.03.2025).
26. Nuclear Power in France. World Nuclear Association. [Электронный ресурс]. URL: https://world-nuclear.org/ (дата обращения: 04.03.2025).
27. Yıldız E.C. Geopolitics of Green Industrial Policy: Nuclear Energy Strategies and Economic Competitiveness in the EU, US, and China. - US, and China, 2025. – 37 p.
Страница обновлена: 17.07.2026 в 16:00:50
Download PDF | Downloads: 14
Formation of the France’s National Strategy in the Global Nuclear Power Plant Construction Market
Goremyshev A.V., Kapustkin V.I.Journal paper
Journal of Economics, Entrepreneurship and Law
Volume 16, Number 4 (April 2026)
Abstract:
In the context of structural changes in the world energy and strengthening the requirements for decarbonization, highly developed nuclear energy is becoming an important aspect in the energy competitive ability of countries in the global economy again. France is one of the historical leaders of the industry. It both has the advantages of a developed national nuclear infrastructure and faces the restrictions on implementation of brand new projects. This article proposes an economic and mathematical model of the France’s national strategy in the global market of nuclear power plant construction based on comparative analysis with key competing countries. Design testing of the model was carried out using the indicators of construction serial pattern, project manageability and levelized cost of electricity (LCOE). The results allow for substantiation of the France’s strategy transformation direction based on learning effect and portfolio manageability.
Keywords: nuclear energy, world economy, international business, world market, construction of nuclear power plants, national strategy, competitiveness, indicator of levelized cost of electricity, LCOE, international business, NPP
JEL-classification: P28, O13, Q47, F23
References:
2025 half-year results (financial highlights)EDF. Retrieved March 04, 2025, from https://www.edf.fr/
Historical construction costs of global nuclear power reactors (2016). Energy Policy. 91 371-382. doi: 10.1016/j.enpol.2016.01.011.
Projected Costs of Generating Electricity 2020 (2020). Paris: OECD Publishing.
Agar A. S., Locatelli G. (2020). Economics of nuclear power plants Sawston, Cambridge: Woodhead Publishing.
Annual Activity Report 2024Orano. Retrieved April 09, 2025, from https://www.orano.group/
Cherkasenko A.I. (2008). Analysis State in Atomic Energy in Russia. Ekonomicheskie nauki. (45). 40-44.
Cherp A., Jewell J., Goldthau A. (2011). Governing global energy: systems, transitions, complexity Global Policy. 2 (1). 75-88. doi: 10.1111/j.1758-5899.2010.00059.x.
Christian von Hirschhausen C., Kemfert C. (2025). Nuclear Power and Geopolitical Cham: Springer.
Company information and publicationsFramatome. Retrieved March 28, 2025, from https://www.framatome.com/
Economics of Nuclear PowerWorld Nuclear Association. Retrieved March 04, 2025, from https://world-nuclear.org/
Fedosova Yu.V. (2006). National strategies in the global NPP construction market Saint Petersburg.
Goremyshev A., Kapustkin V. (2019). World nuclear energy development trends and Russia’s competitiveness at the global nuclear market The Third International Economic Symposium (IES 2018). 448-458.
Goremyshev A.V. (2025). Assessment of position of the People’s Republic of China in the world nuclear power plants’ construction market Journal of Economics, Entrepreneurship and Law. 15 (10). 7145-7168. doi: 10.18334/epp.15.10.123834.
Goremyshev A.V., Kapustkin V.I. (2025). Assessment of the Role and Development Trends of Nuclear Energy in the Global Energy Supply System. Ekonomika, predprinimatelstvo i pravo. 15 (8). 5597-5618. doi: 10.18334/epp.15.8.123351.
Half-year results 2025 (press release)EDF. Retrieved March 04, 2025, from https://www.edf.fr/
Levelized Cost of Energy (LCOE)Lazard. Retrieved March 04, 2025, from https://www.lazard.com/
Mirsiyapov I.I. (2009). International competitiveness of the Russian nuclear power industry M..
Nakano J. (2020). The Changing Geopolitics of Nuclear Energy Washington, D.C.: Center for Strategic and International Studies.
Nuclear Power Reactors in the World. Reference Data Series No. 2International Atomic Energy Agency. Retrieved March 17, 2025, from https://www.iaea.org/publications
Nuclear Power in FranceWorld Nuclear Association. Retrieved March 04, 2025, from https://world-nuclear.org/
Rothwell G. (2022). Projected electricity costs in international nuclear power markets Energy Policy. 164 112905. doi: 10.1016/j.enpol.2022.112905.
Schneider M., Froggatt A., Hazemann J. et al. World Nuclear Industry Status Report 2025Worldnuclearreport.org. Retrieved March 28, 2025, from https://www.worldnuclearreport.org/
Scholten D. (2024). The Power of Energy: The Geopolitics of the Energy Transition E-International Relations. 17
Selyutin S.V. (2014). Current trends in the development of global nuclear energy Moscow.
Thomas S. (2018). The economics of nuclear power: An update Energy Policy. 122 185-192.
World Energy Outlook 2023International Energy Agency. Retrieved March 17, 2025, from https://www.iea.org/reports/world-energy-outlook-2023
Yıldız E.C. (2025). Geopolitics of Green Industrial Policy: Nuclear Energy Strategies and Economic Competitiveness in the EU, US, and China US, and China.