Transmission effects and the interconnectedness between equity and commodity markets during crises
Джураева З.Ф.1
1 Уральский федеральный университет им. первого Президента России Б.Н. Ельцина, Екатеринбург, Россия
Скачать PDF | Загрузок: 18
Статья в журнале
Экономика, предпринимательство и право (РИНЦ, ВАК)
опубликовать статью | оформить подписку
Том 15, Номер 12 (Декабрь 2025)
Эта статья проиндексирована РИНЦ, см. https://elibrary.ru/item.asp?id=89035410
Аннотация:
In this study, we investigate the spillover effects and interconnectedness between stock markets and commodity markets during the pandemic, as well as during political and military conflicts, from 2020 to 2025, using the time varying parameter vector-autoregressive model. Our analyses indicate that the total connectedness index between the financial markets was highest during the COVID-19 pandemic, compared to during the Russian-Ukraine and the Israel-Palestine conflict. We found that, during the pandemic and the Russia-Ukraine conflict, the Russian, German, and American stock markets acted as net transmitters of volatility to other markets. Conversely, the Chinese stock market and the commodity markets were net receivers of volatility from the network. At the onset of the Israel-Palestine conflict, the U.S. stock market and the gold market emerged as the primary transmitters of volatility within the network, while the Israeli and Palestinian stock markets, along with the oil market, were net recipients of volatility. These findings provide valuable insights for policymakers and portfolio investors concerning portfolio formation, adjustment, and hedging strategies in condition of geopolitical uncertainty.
Ключевые слова: crises, financial market, pandemic, Russian-Ukraine conflict, Israel-Palestine conflict, TVP-VAR
JEL-классификация: F14, F15, F36, F51, F65
1. Introduction
Globalization and financial liberalization have accelerated the transfer of shocks and financial risks between markets. The issue of volatility transfer between financial markets is extensively discussed in the scientific literature. This secondary effect of volatility, commonly referred to as contagion, usually arises from the interdependence of economies. Such interdependence implies that shocks in one market can be transmitted across national borders due to financial connections, leading to fluctuations in stock prices and exchange rates among various countries [1] (Abou-Zaid, 2011).
Numerous empirical studies have confirmed this phenomenon. For instance, Mensi et al. (2022) explored the dynamic asymmetric spillover effects of returns between gold and oil futures and 22 European equity sectors. They found that the gold and oil markets serve primarily as net recipients of return flows from the broader financial system, while most equity sectors act as net sources of secondary return effects within the system. The study also noted that time-varying symmetric and asymmetric feedback effects were particularly pronounced during significant events, including the European debt crisis of 2011-12, the oil crisis of 2014-15, the Brexit referendum of 2016, and the COVID-19 pandemic [10] (Mensi, Yousaf, Vo, Kang, 2022). In another study, [14] (Sohag K. et al., 2022) examined the effects of volatility spillover on political uncertainty, global oil prices, exchange rates, stock indexes, and metal prices within the Russian economy. Their findings indicate that gold prices, political uncertainty, oil prices, and stock indexes serve as sources of volatility. Additionally, market capitalization is identified as a net contributor, while the silver market operates as a net recipient. Furthermore, palladium has emerged as a significant source of pure volatility since the global financial crisis. Mellouli, Bejaoui, Jeribi, 2025 [9] investigated the relationship between natural gas and stock indexes in G7, BRICS, and Gulf countries. Their research revealed that overall interconnectedness is heightened in the extremes of the conditional distribution, particularly in the upper quantile during bullish market conditions. In addition, Lin, Ouyang, Yu (2024) [8] studied the impact of the conflict between Israel and Hamas on risk spread in global financial and commodity markets. Their findings demonstrated that the conflict significantly increased overall risk exposure, with short-term consequences proving to be more pronounced than long-term effects.
To enhance the scientific literature on this study, we will consider the following questions: How have the crises of 2020, 2022, and 2023 affected the transfer of risks between global financial markets and the gold and oil markets? In what ways have the general characteristics of risk spread in these markets changed during the pandemic and political crises? Which markets have acted as recipients and transmitters of risks? To answer these questions, we collected data on daily closing prices for Brent crude oil, gold, and stock markets in the United States, Germany, China, Russia, Palestine, and Israel from January 1, 2020, to August 14, 2025. We employed TVP-VAR models to study the interactions in the time-frequency domain of global markets. This article contributes to several sections of the existing literature. Firstly, it enriches the discourse on pandemics and political crises by assessing their impact on international financial markets. Secondly, this study examines significant categories of the global financial system, which enables the identification of risk sources among key financial markets.
Thus, the purpose of this article is to supplement the current literature on the spread of volatility in financial markets by investigating the international transmission of daily volatility fluctuations among stock indices from the USA, Germany, China, Russia, Palestine, and Israel, along with the gold and oil markets during three distinct crises: the COVID-19 pandemic, the Russia-Ukraine conflict, and the Palestine-Israel conflicts. The paper is organized as follows: Section 2 introduces the literature review, Section 3 presents the data and methodology, and finally, Sections 4 and 5 discuss the results and provide conclusions.
2. Literature review
The emergence of the COVID-19 pandemic crisis led to a downturn and increased volatility in financial markets. This crisis was significantly different from similar events in the past, particularly due to its profound negative impact on the economies and financial markets of many countries. The decline in stock markets in developed countries was comparable to that of the Great Depression of 1929-1930. Quarantine measures implemented to reduce the spread of the pandemic, along with restrictions on international travel and border closures, resulted in disruptions to the global supply chain, a decline in economic activity, and an overall recession [11] (Ozili, Arun, 2023).
Several studies have confirmed the adverse consequences of the pandemic on financial markets in both developed and developing countries. Specifically, the effects of new daily COVID-19 cases and deaths on daily market returns and stock market volatility [16] (Ullah, 2023) have been documented, as well as impacts on currency markets [5] (Aslam et al., 2020), metal markets [2] (Ahmed, Sarkodie, 2021), agricultural commodity markets [6] (Hung, 2021), and other segments of the financial sector. The pandemic crisis has also led to a heightened level of risk transmission between these financial markets. In a study conducted by Samitas, Kampouris, Polyzos, 2022 [13], the impact of the COVID-19 pandemic on 51 major stock markets, both emerging and developed, was analyzed. The study highlighted the volatility and contagion risks present in stock markets during the pandemic. It also identified the immediate spread of the financial crisis resulting from quarantine measures and the transmission of the new coronavirus across global markets. The authors concluded that Eurozone countries, which share a common currency, exhibit a strong weighted correlation, demonstrating significant cross-market shock transmission within the EU. Among these countries, France and Germany play central roles in this shock transmission, acting as joint distributors alongside the American and Asian markets. Tan et al., 2022 [15] examined the nature of risk propagation in global financial markets before and during the COVID-19 pandemic. They found that during the intense outbreak of COVID-19, the level of secondary risk in developing countries surged rapidly. In contrast, the secondary financial risk level in developed countries decreased significantly. Notably, China's influence on developed countries intensified, and its financial impact gradually strengthened. Conversely, the United States was identified as the primary transmitter of risks in the global financial market.
In February 2022, financial markets experienced a shock triggered by the political crisis between Russia and Ukraine. This situation caused disruptions in energy supplies and led to increases in prices for raw materials, food, and energy, resulting in global inflation across many countries [3] (Al-Saadi, 2023). Izzeldin et al., 2023 [7] analyzed the consequences of global financial crises, the pandemic, and the Russia-Ukraine war on the global stock markets using a representative sample of commodity assets. They applied a Markov-switching HAR model to assess synchronization, duration, and intensity of each event. The authors discovered that stock markets and commodity prices negatively reacted to the onset of the Russia-Ukraine crisis, with the intensity of the crisis after the invasion being significantly lower than that during both the COVID-19 pandemic and the Global Financial Crisis (GFC). Among commodities, wheat and nickel were found to be the most affected. Additionally, Wang, Su, 2023 [17] studied the effects of the Russia-Ukraine conflict on Chinese industry and financial markets. They identified impacts on the stability of China's commodity and financial systems, particularly noting an increase in risks within energy, chemicals, and grain markets.
The new phase of the Israeli-Palestinian conflict, which began in October 2023, represents the next crisis that continues to negatively affect the global financial system. This ongoing war in the region has contributed to increased volatility in global financial markets, a rise in energy prices, disruptions in trade and global supply chains, as well as heightened risks of recession and high inflation in the Middle East and other economies [11] (Ozili, 2025). Yudaruddin studied market reactions to the Israel-Hamas conflict in the Middle East and North Africa region and determined that countries located near Israel and Palestine experienced negative consequences for their capital markets. The study noted that while the Israeli financial market experienced a decline in prices, the commodity and real estate markets remained exceptions [18] (Yudaruddin, 2024).
3. Methodology
3.1 Data and description of variables
To evaluate the connection between stock markets and commodity markets during the pandemic and periods of political turmoil, we utilize daily data on stock indices from the respective countries alongside daily prices for gold and Brent crude oil. The dataset covers the period from January 1, 2020, to August 20, 2025. In order to analyze the distribution of risk characteristics across these markets, we segmented our data into three distinct sub-periods: the first period addresses the pandemic crisis from January 2020 to December 2021 (comprising 732 observations); the second period covers the conflict between Russia and Ukraine from February 2022 to September 2023 (with 608 observations). Although the conflict persists, we confined our analysis to this timeframe to discern the impacts of the Israeli-Palestinian crisis, which is included in the third period (October 2023 to August 2025, totaling 692 observations). For the stock markets, we selected indices representing the largest market capitalization for each respective country. For instance, in the United States, we incorporated the Standard & Poor's index. The S&P 500 index (Standard & Poor’s 500) encompasses a wide array of industries, enabling it to reflect the overall state of the US economy. The S&P 500 is regarded as a benchmark of efficiency for numerous stock exchanges and is computed using a free-float market capitalization methodology. In Europe, the primary index is the German DAX (Deutscher Aktien Index), which represents the 40 largest and most liquid German companies listed on the Frankfurt Stock Exchange. This index is calculated by averaging the weighted market-capitalization values of the freely traded shares. For the Russian stock market, we utilized the RTS Index, which includes 50 liquid companies. In the case of the Chinese stock market, we incorporated the Shanghai Composite Index (SSEC). For Palestine and Israel, the stock indices employed are Al-Quds and the Tel Aviv Stock Exchange (TA-35). All data were sourced from the investing.com platform.
In order to estimate the transmission of volatility across markets, we utilize the TVP-VAR method, which is grounded in the VAR (Vector Autoregression) framework and is applicable for examining interdependencies and volatility spillovers within financial markets. The TVP-VAR method is distinct from conventional fixed-coefficient VAR models as it permits the coefficients in the linear VAR model to fluctuate according to a designated vector. TVP-VAR represents a time-varying parameter vector autoregression that facilitates the alteration of value dispersion through stochastic volatility estimation via the Kalman filter and a coefficient of missing. The dynamic connectedness inherent in the TVP-VAR framework is well-suited for short time series; furthermore, the connectedness measure derived from TVP-VAR reacts swiftly to events. The following formula defines the TVP-VAR method:
![]() 1)
1)
![]() 2)
2)
where ![]() –
represents an N×1 conditional volatility vector;
–
represents an N×1 conditional volatility vector; ![]() is an
is an ![]() lagged
conditional vector;
lagged
conditional vector; ![]() is an
is an ![]() dimensional time-varying coefficient matrix;
dimensional time-varying coefficient matrix; ![]() is
an N×1 dimensional error disturbance vector with an N×N time varying
variance-covariance matrix,
is
an N×1 dimensional error disturbance vector with an N×N time varying
variance-covariance matrix, ![]() .
The parameters
.
The parameters ![]() depend on their own values
depend on their own values ![]() and
on an
and
on an ![]() dimensional error matrix with an
dimensional error matrix with an ![]() variance-covariance matrix [4] (Antonakakis,
Gabauer, 2017).
variance-covariance matrix [4] (Antonakakis,
Gabauer, 2017).
4. Results and discussions
To demonstrate market behavior in times of crisis, we initially showcased the dynamics of market volatility in Figure 1.
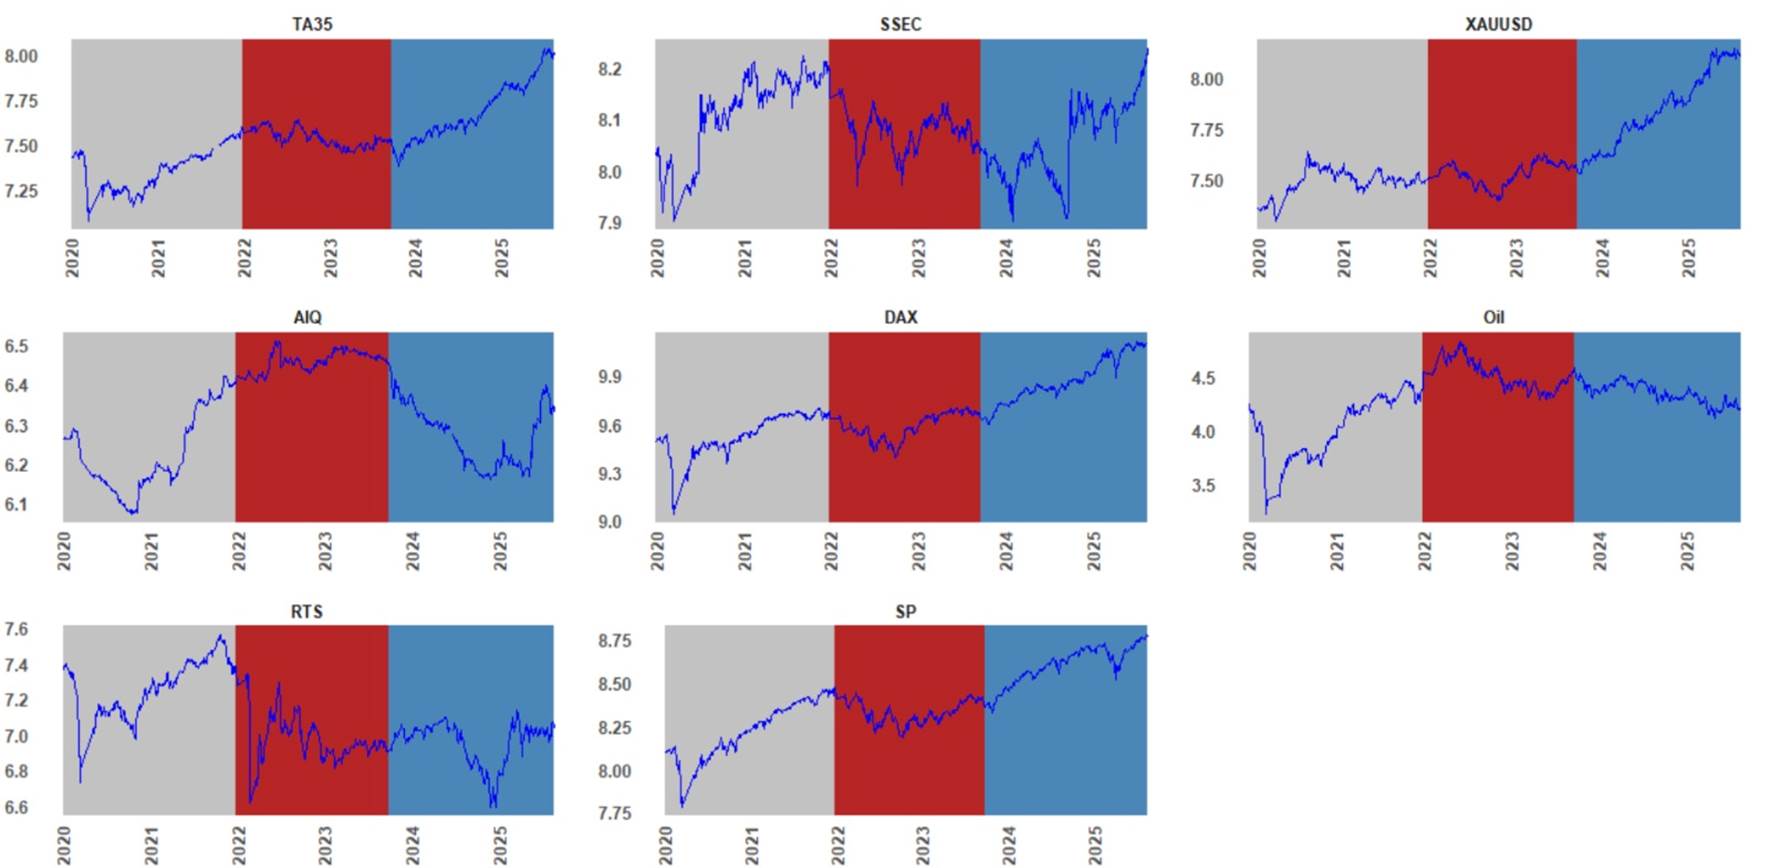
Fig. 1. Dynamics of TA35, AIQ, RTS, SSEC, DAX, SP stock prices, and oil and gold volatilities. Note. The figure illustrates general trends of the market value over the full sample period (from January 6, 2020, to August 21, 2025), the grey area shows the period preceding COVID, the red area is the period of the conflict between Russia and Ukraine, and the blue area is the conflict between Israel and Palestine.
Source: Compiled by the author based on data from investing.com
Initially, Figure 1 illustrates the structure of the time series, particularly focusing on the price movements of the analyzed stock markets, oil, and gold. The trends observed in the stock markets and oil reveal both similarities and differences. In the time leading up to the pandemic, all markets faced significant price drops, particularly at the start of 2020, followed by a phase of recovery and growth. During the Russian-Ukrainian conflict, the AlQ and Oil markets exhibited comparable upward trends, whereas the RTS and SSEC markets experienced sharp declines and considerable volatility. Additionally, the DAX, SP, TA35, and XAUUSD markets also demonstrated significant instability. The onset of the new phase of the Israel-Palestine conflict indicates that the AIQ, RTS, and SSEC markets underwent substantial declines. Conversely, the DAX, and SP markets experienced moderate growth, with the exception of the oil market, which showed a slight decline. Meanwhile, gold, along with US and Israeli stocks, displayed consistent growth.
Table 1 reports the descriptive analysis. The standard deviations are considerably low in all three periods of conflict, indicating a high degree of consistency in the data.
|
COVID-19
|
TA35
|
ALQ
|
RTS
|
SSEC
|
DAX
|
SP
|
XAUUSD
|
OIL
|
|
Mean
|
0.0005
|
0.0005
|
0.0001
|
0.0005
|
0.0006
|
0.0013
|
0.0005
|
0.0005
|
|
Max
|
0.1369
|
0.0343
|
0.2081
|
0.0755
|
0.2085
|
0.1674
|
0.1363
|
0.1348
|
|
Min
|
-0.1530
|
-0.0464
|
-0.1979
|
-0.0804
|
-0.1348
|
-0.1000
|
-0.0590
|
-0.3342
|
|
Std. Dev.
|
0.0178
|
0.0070
|
0.0270
|
0.0141
|
0.0217
|
0.0187
|
0.0145
|
0.0350
|
|
Skewness
|
-0.8963
|
0.0963
|
-0.3423
|
-0.0809
|
1.2458
|
0.9290
|
1.9506
|
-3.1230
|
|
Kurtosis
|
32.0917
|
13.8366
|
24.7709
|
10.2346
|
38.3901
|
28.5380
|
28.0091
|
31.9303
|
|
Jarque-Bera
|
10902.464***
|
1507.525***
|
6088.668***
|
672.022***
|
16152.889***
|
8414.090***
|
8221.957***
|
11241.697***
|
|
ERS
|
-7.409***
|
-5.601***
|
-5.703***
|
-6.697***
|
-5.237***
|
-8.049***
|
-6.504***
|
-2.517**
|
|
Q(10)
|
9.299*
|
31.554***
|
22.017***
|
8.951
|
20.193***
|
9.610*
|
5.884
|
12.343**
|
|
Q2(10)
|
53.571***
|
7.261
|
68.383***
|
4.237
|
49.562***
|
49.490***
|
1.941
|
13.369**
|
|
RUS-UKR
| ||||||||
|
Mean
|
-0.0002
|
0.0001
|
-0.0014
|
-0.0004
|
0.0000
|
-0.0002
|
0.0001
|
0.0002
|
|
Max
|
0.0551
|
0.0213
|
0.1378
|
0.0373
|
0.0346
|
0.0540
|
0.0440
|
0.1834
|
|
Min
|
-0.0622
|
-0.0598
|
-0.4829
|
-0.0732
|
-0.0651
|
-0.0857
|
-0.0310
|
-0.1108
|
|
Std. Dev.
|
0.0129
|
0.0062
|
0.0429
|
0.0121
|
0.0137
|
0.0160
|
0.0103
|
0.0296
|
|
Skewness
|
-0.3813
|
-3.3428
|
-5.7570
|
-1.0128
|
-0.7348
|
-0.7683
|
0.3994
|
0.5488
|
|
Kurtosis
|
6.1501
|
37.5447
|
64.0456
|
8.7093
|
5.1946
|
7.3724
|
4.6198
|
8.5080
|
|
Jarque-Bera
|
113.803***
|
13412.036***
|
41807.319***
|
397.572***
|
75.576***
|
232.686***
|
35.334***
|
341.718***
|
|
ERS
|
-5.875***
|
-4.517***
|
-4.929***
|
-4.754***
|
-6.717***
|
-4.801***
|
-5.710***
|
-4.859***
|
|
Q(10)
|
5.2050
|
5.8220
|
27.123***
|
5.1040
|
1.9640
|
6.8700
|
9.459*
|
8.0620
|
|
Q2(10)
|
3.1770
|
0.0950
|
4.9090
|
2.3540
|
11.500**
|
8.4090
|
10.109*
|
3.2610
|
|
ISR_PLS
| ||||||||
|
Mean
|
0.0018
|
-0.0003
|
0.0004
|
0.0006
|
0.0016
|
0.0013
|
0.0019
|
-0.0009
|
|
Max
|
0.0371
|
0.0379
|
0.1295
|
0.1060
|
0.0443
|
0.0909
|
0.0397
|
0.0727
|
|
Min
|
-0.0442
|
-0.0436
|
-0.0821
|
-0.0685
|
-0.0685
|
-0.0798
|
-0.0423
|
-0.1102
|
|
Std. Dev.
|
0.0112
|
0.0089
|
0.0222
|
0.0139
|
0.0115
|
0.0125
|
0.0118
|
0.0228
|
|
Skewness
|
-0.2790
|
0.2249
|
0.6331
|
0.6535
|
-0.9264
|
-0.2311
|
-0.1062
|
-0.5888
|
|
Kurtosis
|
3.8926
|
7.7577
|
8.1195
|
17.1993
|
9.0845
|
18.1517
|
4.2286
|
5.2679
|
|
Jarque-Bera
|
14.084***
|
290.239***
|
353.455***
|
2583.960***
|
514.104***
|
2920.217***
|
19.754***
|
82.987***
|
|
ERS
|
-3.760***
|
-2.276**
|
-5.797***
|
-5.516***
|
-2.424**
|
-6.931***
|
-7.571***
|
-9.021***
|
|
Q(10)
|
3.2180
|
18.090***
|
15.486***
|
4.1920
|
7.7200
|
10.972**
|
14.749***
|
14.764***
|
|
Q2(10)
|
3.1180
|
14.574***
|
17.214***
|
45.998***
|
76.609***
|
133.464***
|
19.513***
|
8.1870
|
Table 2. Overall interconnectedness among stock markets, gold, and oil during crisis periods
|
COVID-19
|
|
|
|
|
|
|
|
|
|
|
|
TA35
|
AlQ
|
RTS
|
SSEC
|
DAX
|
SP
|
XAUUSD
|
Oil
|
FROM
|
|
TA35
|
43.31
|
1.56
|
13.15
|
4.02
|
14.71
|
13.38
|
2.27
|
7.6
|
56.69
|
|
AlQ
|
2.54
|
78.83
|
1.81
|
3.04
|
2.81
|
2.64
|
4.66
|
3.68
|
21.17
|
|
RTS
|
12.28
|
2.12
|
43.53
|
1.96
|
13.4
|
9.84
|
3.39
|
13.48
|
56.47
|
|
SSEC
|
6.47
|
3.89
|
6.22
|
63.13
|
4.93
|
5.57
|
4.3
|
5.5
|
36.87
|
|
DAX
|
13.74
|
1.79
|
13.27
|
2.26
|
40.78
|
18.02
|
2.49
|
7.64
|
59.22
|
|
SP
|
13.24
|
1.66
|
10.22
|
2.34
|
18.43
|
41.62
|
3.64
|
8.85
|
58.38
|
|
XAUUSD
|
3.7
|
4.27
|
6.8
|
3.13
|
4.92
|
6.77
|
67.07
|
3.34
|
32.93
|
|
Oil
|
8.17
|
3.61
|
15.77
|
2.87
|
8.24
|
9.84
|
1.56
|
49.94
|
50.06
|
|
Contribution
to others
|
60.14
|
18.89
|
67.25
|
19.63
|
67.43
|
66.06
|
22.3
|
50.09
|
371.78
|
|
Contribution
including own
|
103.44
|
97.72
|
110.78
|
82.76
|
108.21
|
107.67
|
89.37
|
100.04
|
TCI
|
|
NET Spillover
|
3.44
|
-2.28
|
10.78
|
-17.24
|
8.21
|
7.67
|
-10.63
|
0.04
|
46.47
|
|
RUS-UKR
|
|
|
|
|
|
|
|
|
|
|
TA35
|
AlQ
|
RTS
|
SSEC
|
DAX
|
SP
|
XAUUSD
|
Oil
|
FROM
| |
|
TA35
|
58.09
|
1.8
|
2.81
|
1.71
|
15.16
|
13.48
|
5.27
|
1.67
|
41.91
|
|
AlQ
|
2.43
|
71.1
|
7.86
|
4.13
|
6.21
|
1.29
|
3.55
|
3.41
|
28.9
|
|
RTS
|
3.59
|
6.05
|
67.72
|
4.3
|
9.72
|
3.57
|
1.91
|
3.14
|
32.28
|
|
SSEC
|
1.59
|
5.56
|
5.08
|
70.87
|
6.92
|
3.09
|
3.43
|
3.46
|
29.13
|
|
DAX
|
13.16
|
3.85
|
8.07
|
5.05
|
46.13
|
16.81
|
4.33
|
2.61
|
53.87
|
|
SP
|
13.57
|
1.46
|
2.74
|
3.33
|
17.96
|
50.62
|
6.52
|
3.8
|
49.38
|
|
XAUUSD
|
5.74
|
3.65
|
1.83
|
2.6
|
4.94
|
6.55
|
70.06
|
4.63
|
29.94
|
|
Oil
|
2.02
|
4.32
|
5.97
|
2.98
|
3.43
|
5.13
|
4.73
|
71.42
|
28.58
|
|
Contribution
to others
|
42.1
|
26.68
|
34.35
|
24.11
|
64.35
|
49.91
|
29.75
|
22.72
|
293.98
|
|
Contribution
including own
|
100.19
|
97.78
|
102.07
|
94.98
|
110.48
|
100.54
|
99.81
|
94.14
|
TCI
|
|
NET Spillover
|
0.19
|
-2.22
|
2.07
|
-5.02
|
10.48
|
0.54
|
-0.19
|
-5.86
|
36.75
|
|
ISR_PLS
|
|
|
|
|
|
|
|
|
|
|
TA35
|
AlQ
|
RTS
|
SSEC
|
DAX
|
SP
|
XAUUSD
|
Oil
|
FROM
| |
|
TA35
|
63.49
|
2.86
|
3.56
|
3.46
|
13.21
|
8.94
|
2.43
|
2.04
|
36.51
|
|
AlQ
|
3.01
|
69.99
|
2.65
|
5.71
|
4.98
|
5.9
|
3.51
|
4.26
|
30.01
|
|
RTS
|
2.41
|
2.63
|
79.16
|
2.24
|
4.16
|
3.49
|
2.96
|
2.95
|
20.84
|
|
SSEC
|
3.39
|
4.55
|
2.66
|
70.86
|
3.58
|
6.76
|
4.28
|
3.92
|
29.14
|
|
DAX
|
10.5
|
3.76
|
3.07
|
3.78
|
54.17
|
16.83
|
4.59
|
3.31
|
45.83
|
|
SP
|
7.22
|
3.72
|
2.31
|
5.69
|
14.14
|
58.26
|
4.54
|
4.13
|
41.74
|
|
XAUUSD
|
2.03
|
2.72
|
2.54
|
4.41
|
4.46
|
5.26
|
74.41
|
4.18
|
25.59
|
|
Oil
|
2.08
|
2.28
|
4.4
|
3.96
|
2.9
|
5.53
|
4.95
|
73.92
|
26.08
|
|
Contribution
to others
|
30.64
|
22.51
|
21.17
|
29.25
|
47.42
|
52.71
|
27.26
|
24.79
|
255.74
|
|
Contribution
including own
|
94.13
|
92.5
|
100.33
|
100.11
|
101.59
|
110.97
|
101.67
|
98.71
|
TCI
|
|
NET Spillover
|
-5.87
|
-7.5
|
0.33
|
0.11
|
1.59
|
10.97
|
1.67
|
-1.29
|
31.97
|
The information regarding the interconnectedness and spillover effects of volatility among oil, gold, and stock markets is detailed in Table 2. Throughout the entire duration of the pandemic crisis, the level of synchronization was recorded at 46.47%. In the contexts of the Russian-Ukrainian conflict and the Israel-Palestine conflict, the TCI values were noted as 36.75% and 31.97%, respectively. The rise in TCI during the pandemic period signifies an increase in risk transfer among the markets when compared to the conflict periods. This observation is consistent with other research that has indicated that the transmission of volatility between markets during the pandemic crisis, which resulted in economic shocks, was considerably greater than during military-political crises [14] (Sohag K. et al., 2022).
In the final column of Table 2, the term "From" denotes the recipients of volatility from the analyzed assets to specific assets. The findings reveal that during the pandemic crisis, the TA35 stock market experienced the highest volatility from the DAX (14.71%), SP (13.38%), and RTS (13.15%) markets. The primary sources of volatility transfer to the AIQ market were XAUUSD (4.66%), Oil (3.68%), and SSEC (3.04%). RTS encountered the highest volatility, with transfers originating from Oil (13.48%), DAX (13.4%), and TA35 (12.28%). The SSEC market received the most volatility from TA35 (6.47%), RTS (6.22%), and SP (5.57%). During the pandemic crisis, DAX received the highest volatility from SP (18.02%), TA35 (13.74%), and RTS (13.27%). For SP, the largest sources of volatility were DAX (18.43%), TA35 (13.24%), and RTS (10.22%). For gold (XAUUSD), the sources of volatility were RTS (6.8%) and SP (6.77%). The oil market experienced the highest volatility, with transfers from RTS (15.77%), SP (9.84%), and DAX (8.24%). In summary, the assets that received the most volatility from stock, oil, and gold markets were DAX (59.22%), SP (58.38%), TA35 (56.69%), and RTS (56.47%). The primary transmitters of volatility to other markets during the pandemic period were the DAX (67.43%), RTS (67.25%), and SP (66.06%) markets.
The onset of the conflict in Ukraine led to increased volatility in the financial markets, with the synchronization level (TCI) noted at 36.75%. The markets that experienced the most significant volatility during the conflict included the DAX (53.87%), SP (49.38%), TA35 (41.91%), and RTS (32.28%). The primary sources of volatility in the analyzed markets were the DAX (64.35%), SP (49.91%), TA35 (42.1%), and RTS (34.35%). Throughout the Ukraine conflict, TA35 witnessed the greatest transfer of volatility from the DAX (15.16%) and SP (13.48%); AIQ received volatility from RTS (7.68%) and DAX (6.21%); RTS was influenced by DAX (9.72%), AIQ (6.05%), and SSEC (4.3%); SSEC experienced volatility from DAX (6.92%), AIQ (5.56%), and RTS (5.08%); DAX was affected by SP (16.81%) and TA35 (13.16%); SP was influenced by DAX (17.96%) and TA35 (13.57%). The leading transmitter of volatility for the gold market was SP (6.55%), followed by TA35 (5.74%) and DAX (4.94%). Significant sources of volatility for the oil markets were the Russian stock market RTS (5.97%) and the US index SP (5.13%).
The Israeli-Palestinian conflict stands as one of the enduring conflicts throughout history. On October 7, 2023, a new chapter in this conflict commenced, resulting in the tragic loss of numerous innocent children, elderly individuals, and women, while also hindering the educational opportunities for the youth. The two-year blockade has exacerbated the rise of poverty. Our assessments indicated that during this timeframe, the synchronization level (TCI) among markets was 14.14% lower in comparison to the pandemic crisis period, which was recorded at 31.97%. The primary recipients of volatility among the markets analyzed included DAX (45.83%), SP (41.74%), and TA35 (36.51%). The volatility transmitters affecting other markets were SP (52.71%), DAX (47.42%), and TA35 (30.64%). TA35 experienced the majority of its volatility from DAX (13.21%) and SP (8.94%); AIQ received volatility from SP (5.9%) and SSEC (5.71%); RTS was influenced by DAX (4.16%) and SP (3.49%); SSEC was affected by SP (6.76%), AIQ (4.55%), and XAUUSD (4.28%); DAX was influenced by SP (16.83%) and TA35 (10.5%); SP received volatility from TA35 (7.22%), DAX (14.14%), and SSEC (5.69%); XAUUSD was affected by SP (5.26%), DAX (4.46%), and SSEC (4.41%); Oil was influenced by SP (5.53%), XAUUSD (4.95%), and RTS (4.4%). The "NET spillovers" metric presented in the final row of the table illustrates the net reliance of directed volatility for each asset. Negative (or positive) figures indicate that the market acts as a pure receiver (or exporter) of systemic volatility. In particular, during the pandemic crisis, the net recipients of volatility included SSEC (-17.24%) and XAUUSD (-10.63%); during the Russia-Ukraine conflict, Oil (-5.86%) and SSEC (-5.02%); and during the Israeli-Palestinian conflict, AIQ (-7.5%) and TA35 (-5.87%). The net transmitters (exporters) of volatility to other markets during the pandemic crisis were RTS (10.78%) and DAX (8.21%); during the Russia-Ukraine conflict, DAX (10.48%) and RTS (2.07%); and during the Israeli-Palestinian conflict, SP (10.97%) and XAUUSD (1.67%).
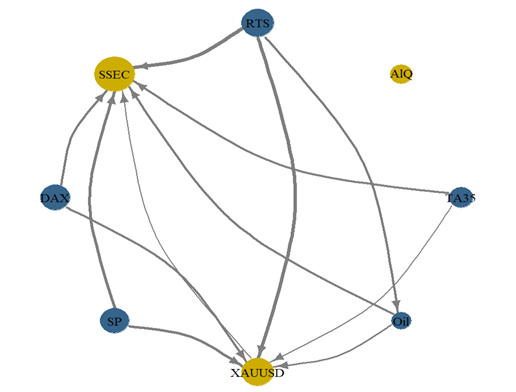
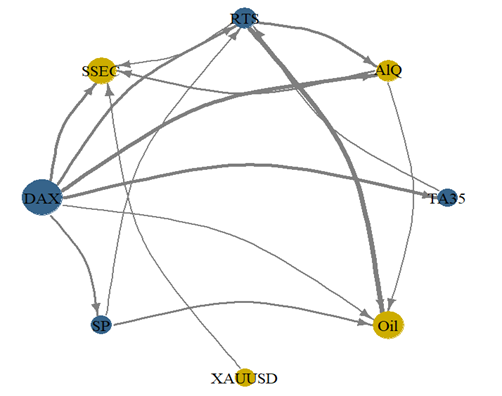

a) Covid-19 period b) RUS-UKR conflict b) ISR_PS conflict
Fig. 2. Distribution of directed volatility between markets. This figure shows a network diagram of the distribution of directed volatility among the markets studied during the periods of the COVID-19 pandemic, the Russia-Ukraine conflict, and the Israeli-Palestinian conflict, in parts a, b, and c, respectively.
Source: Compiled by the author
In Figure 2, we have illustrated a network diagram that depicts the relationship among the stock market, gold, and oil concerning static directed volatility. The arrows within the diagram signify the direction of volatility transmission, with the arrowheads directed toward net receivers and the bases denoting net transmitters. The nodes marked in yellow and blue indicate the recipients and transmitters of volatility, respectively, while the size of the nodes represents the extent of pairwise volatility transmission. These visual depictions corroborate the previous findings shown in Table 2. Consequently, the analysis reveals that RTS, DAX, and SP serve as pure sources of shocks, whereas AIQ operates as a pure receiver throughout the entire sample period. It is noteworthy that gold, oil, and the markets of China and Israel display varying behaviors across different periods of the sample. Specifically, gold and SSEC acted as recipients during the COVID and Russia-Ukraine conflict periods, while they functioned as transmitters during the Israel-Palestine conflict. Conversely, oil served as a transmitter solely during the pandemic crisis, acting as a receiver in other periods. Meanwhile, TA 35 functioned as a volatility transmitter during the pandemic and Russia-Ukraine conflict, and as a receiver during the Israel-Palestine conflict.
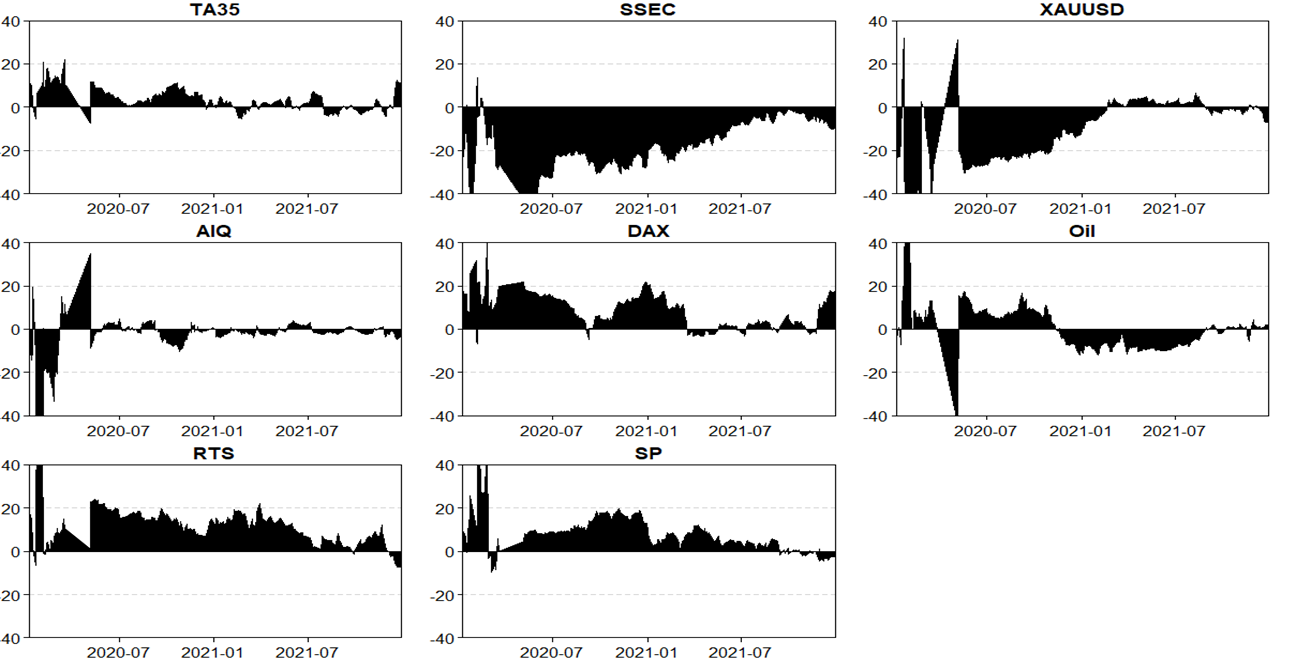
Fig. 3. NET Connectedness. The impact of net volatility on the stock, gold, and oil markets. This figure illustrates the influence of net dynamic overall volatility on each of the studied markets during the pandemic crisis period.
Source: Compiled by the author
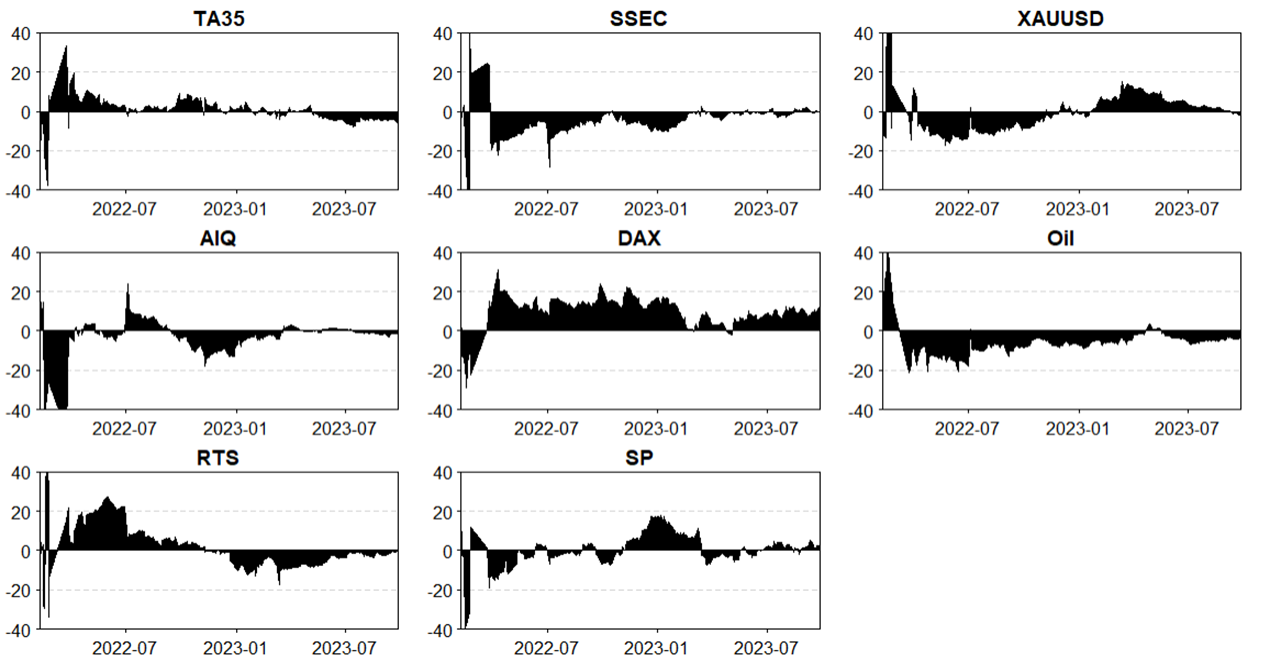
Fig. 4. NET Connectedness. The impact of net volatility on the stock, gold, and oil markets. This figure demonstrates the influence of net dynamic overall volatility on each of the studied markets throughout the entire period of the Russia-Ukraine conflict.
Source: Compiled by the author
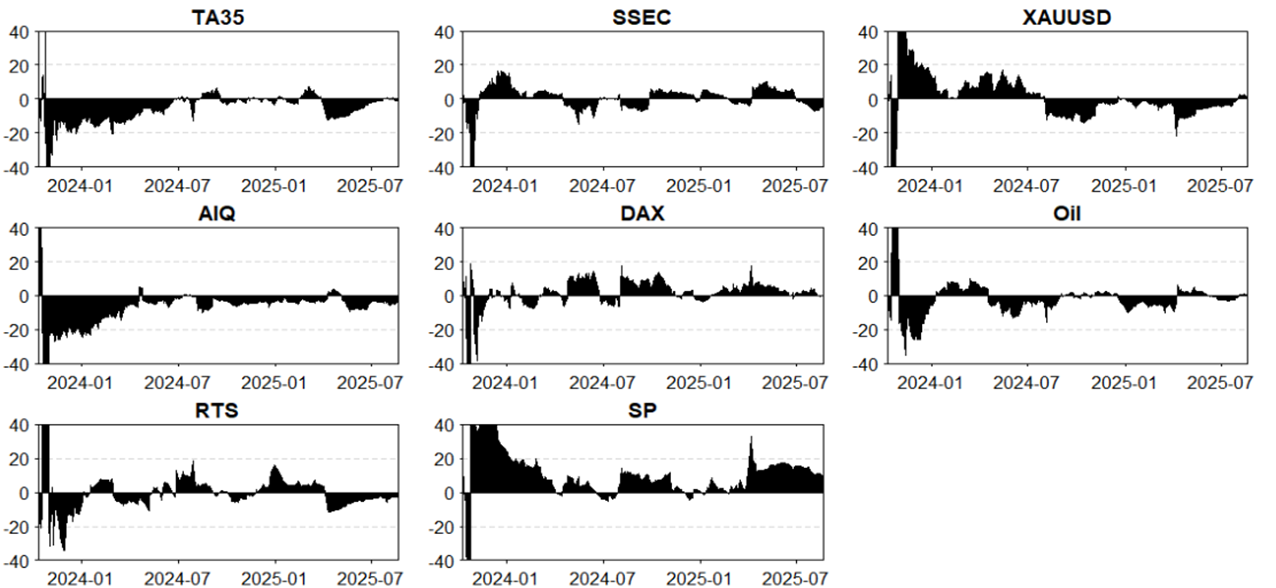
Fig. 5. NET connectedness. The impact of net volatility on the stock, gold, and oil markets. This figure shows the influence of net dynamic overall volatility on each of the studied markets during the Israel-Palestine conflict period.
Source: Compiled by the author
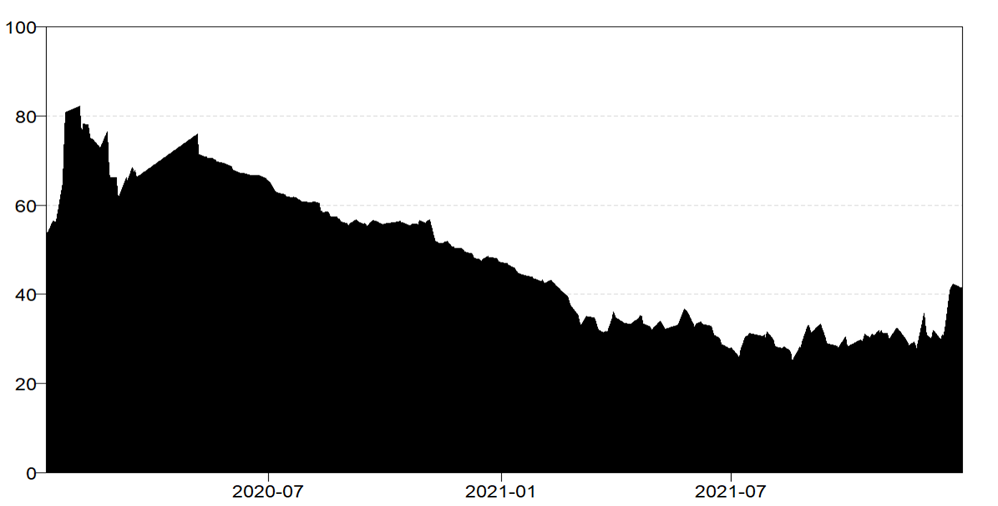
Figures 3-5 depict the net spillover effects resulting from return fluctuations within the network throughout the analysed period. The stock markets of Germany, Russia, and the United States act as immediate sources of shocks to the network during the pandemic crisis. Conversely, the Chinese stock index and the gold market experience shocks that originate from the network in their purest form. Simultaneously, the oil market functions as a volatility diffuser at the onset of the pandemic and as a recipient of volatility within the network by mid-March. Our findings validate that the German, Russian, and American stock markets are the primary sources of shocks to the network during the COVID-19 crisis.
The political crisis also affected the indices of other stock markets, although its repercussions were less severe in comparison to the pandemic. The Russia-Ukraine conflict stands out as one of the most significant factors affecting the efficacy of market returns. As illustrated in Figure 4, the principal sources of volatility transmission within the network at the onset of the conflict were the Russian and Chinese markets, along with the oil and gold markets. Following February 2022, the German, Russian, and Israeli markets emerged as sources of volatility within the network. Beginning at the end of November 2022, the Russian market transitioned to a role as a recipient of volatility from the network. Additionally, the Chinese asset market and commodity market, starting in March 2022, also became recipients of network volatility, thereby confirming the conflict's impact on these markets. The Israeli-Palestinian conflict has also resulted in significant fluctuations and heightened shock transmission among markets. In October 2023, at the onset of the conflict, the primary transmitters of volatility to other markets within the network included TA35, AIQ, RTS, and Oil. Beginning in November, the sources of volatility within the network shifted to SP, XAUUSD, and DAX. The markets TA35, AIQ, and Oil transitioned to being recipients of network volatility. Figure 6 illustrates the time-rolling trajectory of total return connectedness throughout the entire sample period.
a) Covid-19 period
b) RUS-UKR conflict
b) ISR_PS conflict
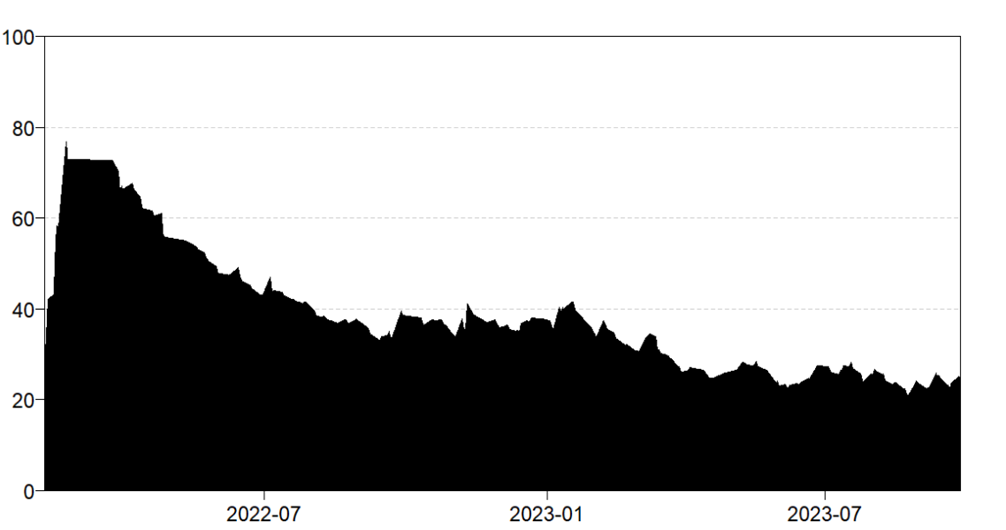
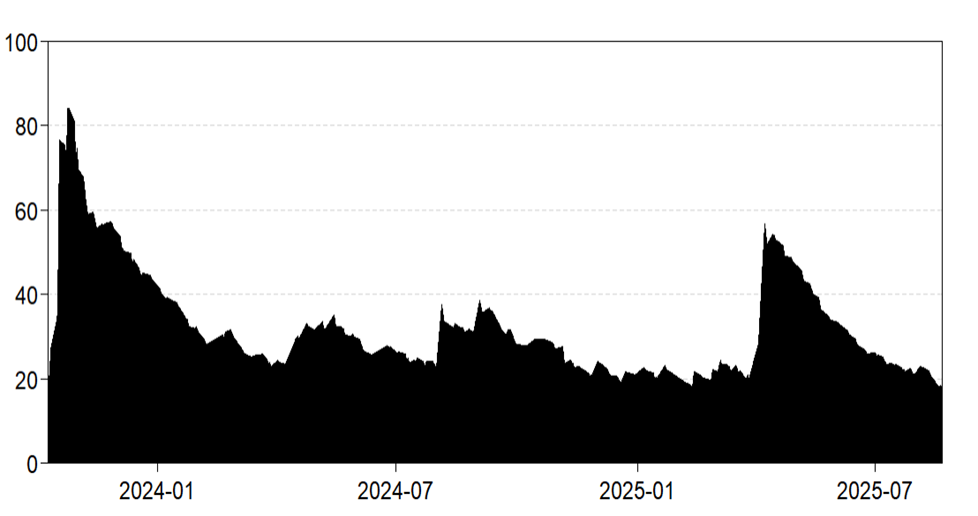
Fig. 6. Dynamic Total Connectedness across key global disruptions: Pandemic, Russian-Ukraine conflict, and Israel-Palestine conflict.
Source: Compiled by the author
At the beginning of 2020, the TCI was very high until the end of 2020. Afterward, the TCI decreased significantly until the end of 2021. It then, as we can see on Fig 10 b), TCI increased at a gentle pace until the end of 2022 due to the start of the conflict between Russia and Ukraine. After the starting the new phase of Israel -Palestinian conflicts the increase in the TCI reveals a rise in risk transfer among stock and commodity market indices from October 2023, in the period of 2024 the fluctuations of TCI were unstable and law, from middle of 2025 TCI increased due to wors condition in Gaza and announcing by Israel blockade in Gaza and intensification of hostilities in Gaza. Therefore, risk management and the diversification of asset portfolios are vital for investors in specific periods. These findings corroborate the analyses presented in the literature, which highlight the adverse effects of the pandemic and political crises on market dynamics [16; 15] (Ullah, 2023; Tan et al., 2022)
5. Conclusion
Our empirical findings enhance the existing literature by addressing a significant gap: the insufficient attention given to network market dynamics amid recent pandemic and political crises. Since previous studies have predominantly neglected these timeframes, this research empirically examines the effects of volatility spillovers between equity and commodity markets using the Time-Varying Parameter Vector Autoregression (TVP-VAR) methodology. In particular, we investigate the effects of the COVID-19 pandemic, along with two geopolitical and military conflicts the Russia-Ukraine conflict and the Israel-Palestine conflict on the interrelation of market returns. Additionally, we analyze these relationships across three separate sub-samples that correspond to the respective crises, thereby providing a detailed understanding of the temporal variations in market interconnectedness during these periods.
Additionally, we constructed a network to illustrate volatility transmission among asset pairs across the three sample periods. This network analysis enabled the identification of structural changes in both equity and commodity markets, thereby providing insights into shifts in market interconnectedness. Furthermore, we developed a dynamic model capturing the evolution of overall returns among assets, emphasizing the time-varying nature of these relationships. Our approach also elucidated the dynamic interplay of implied volatility, highlighting how each asset receives and transmits volatility over time.
The empirical results revealed that, during the COVID-19 pandemic, the Chinese stock market and gold acted as primary recipients of volatility, whereas the Russian, German, and U.S. stock markets primarily served as volatility transmitters within the network. In the initial phases of the Russia-Ukraine conflict, volatility was predominantly transmitted from the Russian stock market, oil, and gold. However, by mid-2022, the flow of volatility shifted, with oil, gold, Chinese, and Palestinian stock markets becoming net recipients. The Israel-Palestine conflict similarly induced instability across equity and commodity markets; specifically, in early October 2023, the main transmitters of volatility were the Israeli (TA35), Palestinian (AIQ), Russian stock markets, and oil. Subsequently, certain markets, notably the U.S. stock market (S&P) and gold, became recipients of volatility, with the Israeli and Palestinian markets—specifically TA35 and AIQ—being the most affected. These findings provide valuable insights for investors to optimize portfolio diversification strategies, especially during periods of geopolitical and economic turmoil.
Источники:
2. Ahmed M. Y., Sarkodie S. A. COVID-19 pandemic and economic policy uncertainty regimes affect commodity market volatility // Resources policy. – 2021. – № 74. – p. 102303.
3. Al-Saadi N. Russian-Ukrainian War's Effects on the World Economy // Journal of Exploratory Studies in Law and Management. – 2023. – № 10(1). – p. 8-21.
4. Antonakakis N., Gabauer D. Refined measures of dynamic connectedness based on TVP-VAR. MPRA Paper No. 78282, 2017. [Электронный ресурс]. URL: https://mpra.ub.uni-muenchen.de/78282/1/MPRA_paper_78282.pdf (дата обращения: 13.12.2025).
5. Aslam F., Aziz S., Nguyen D. K., Mughal K. S., Khan M. On the efficiency of foreign exchange markets in times of the COVID-19 pandemic // Technological forecasting and social change. – 2020. – № 161. – p. 120261.
6. Hung N. T. Oil prices and agricultural commodity markets: Evidence from pre and during COVID-19 outbreak // Resources policy. – 2021. – № 73. – p. 102236.
7. Izzeldin M., Muradoğlu Y. G., Pappas V., Petropoulou, A., Sivaprasad S. The impact of the Russian-Ukrainian war on global financial markets // International Review of Financial Analysis. – 2023. – № 87. – p. 102598.
8. Lin Z. L., Ouyang W. P., Yu Q. R. Risk spillover effects of the Israel–Hamas War on global financial and commodity markets: A time–frequency and network analysis // Finance Research Letters. – 2024. – № 66. – p. 105618.
9. Mellouli D., Bejaoui A., Jeribi A. Analyzing quantile and frequency connectedness between natural gas and stock markets amid turbulent times: evidence from G7, BRICS, and Gulf countries // Journal of Chinese Economic and Business Studies. – 2025. – № 1–41.
10. Mensi W., Yousaf I., Vo X. V., Kang S. H. Asymmetric spillover and network connectedness between gold, BRENT oil and EU subsector markets // Journal of International Financial Markets, Institutions and Money. – 2022. – № 76. – p. 101487.
11. Ozili P. K. Impact of the Israel-Hamas War on the global economy. International Relations Dynamics in the 21st Century: Security, Conflicts, and Wars. - IGI Global Scientific Publishing, 2025. – 279-296 p.
12. Ozili P. K., Arun T. Spillover of COVID-19: impact on the Global Economy. Managing inflation and supply chain disruptions in the global economy. - IGI Global Scientific Publishing, 2023. – 41-61 p.
13. Samitas A., Kampouris E., Polyzos S. Covid-19 pandemic and spillover effects in stock markets: A financial network approach // International Review of Financial Analysis. – 2022. – № 80. – p. 102005.
14. Sohag K., Husain S., Chukavina K., Al Mamun Md. Policy Uncertainty, Oil Price, Stock Market and Precious Metal Markets Volatility Spillovers in the Russian Economy // Economy of regions. – 2022. – № 18(2). – p. 383 -397. – doi: 10.17059/ekon.reg.2022-2-6.
15. Tan X., Ma S., Wang X., Feng C., Xiang L. The impact of the COVID-19 pandemic on the global dynamic spillover of financial market risk // Frontiers in Public Health. – 2022. – № 10. – p. 963620.
16. Ullah S. Impact of COVID-19 pandemic on financial markets: A global perspective // Journal of the Knowledge Economy. – 2023. – № 14(2). – p. 982-1003.
17. Wang M., Su Y. How Russian-Ukrainian geopolitical risks affect Chinese commodity and financial markets? // Finance Research Letters. – 2023. – № 56. – p. 104179.
18. Yudaruddin R., Lesmana D., Yudaruddin Y. A., Ekşi̇ İ. H., Başar B. D. Impact of the Israel–Hamas conflict on financial markets of MENA region–a study on investors’ reaction // Journal of Economic and Administrative Sciences. – 2024.
Страница обновлена: 11.06.2026 в 01:34:13
Download PDF | Downloads: 18
Эффекты перетока и взаимосвязь между фондовыми и товарными рынками в условиях кризиса
Dzhuraeva Z.F.Journal paper
Journal of Economics, Entrepreneurship and Law
Volume 15, Number 12 (december 2025)
Abstract:
В этом исследовании мы рассмотрели эффекты перетока и взаимосвязь между фондовыми и товарными рынками во время пандемии, а также во время политических и военных конфликтов, используя ежедневные данные за период с 2020 по 2025 год на основании метода векторно-авторегрессионной модели с изменяющимися во времени параметрам. Наш анализ показывает, что общий индекс взаимосвязанности между рынками был самым высоким во время пандемии COVID-19, по сравнению с российско-украинским и израильско-палестинским конфликтами. Мы обнаружили, что в период пандемии и российско-украинского конфликта российский, немецкий и американский фондовые рынки являются основным источником волатильности. В то время как фондовый рынок Китая и товарные рынки являются основными получателями волатильности. В начале израильско-палестинского конфликта фондовый рынок США и рынок золота стали основными источниками волатильности в сети, и израильский и палестинский фондовые рынки, наряду с рынком нефти, являются чистыми получателями волатильности. Данные результаты дают ценную информацию регулирующим органам и портфельным инвесторам относительно стратегий формирования, корректировки и хеджирования портфеля ценных бумаг в условиях геополитической неопределенности.
Keywords: кризисы, финансовый рынок, пандемия, российско-украинский конфликт, израильско-палестинский конфликт, TVP-VAR
JEL-classification: F14, F15, F36, F51, F65
References:
Abou-Zaid A. S. (2011). Volatility spillover effects in emerging MENA stock markets Review of Applied Economics. (7). 107-127.
Ahmed M. Y., Sarkodie S. A. (2021). COVID-19 pandemic and economic policy uncertainty regimes affect commodity market volatility Resources policy. (74). 102303.
Al-Saadi N. (2023). Russian-Ukrainian War's Effects on the World Economy Journal of Exploratory Studies in Law and Management. (10(1)). 8-21.
Antonakakis N., Gabauer D. Refined measures of dynamic connectedness based on TVP-VARMPRA Paper No. 78282, 2017. Retrieved December 13, 2025, from https://mpra.ub.uni-muenchen.de/78282/1/MPRA_paper_78282.pdf
Aslam F., Aziz S., Nguyen D. K., Mughal K. S., Khan M. (2020). On the efficiency of foreign exchange markets in times of the COVID-19 pandemic Technological forecasting and social change. (161). 120261.
Hung N. T. (2021). Oil prices and agricultural commodity markets: Evidence from pre and during COVID-19 outbreak Resources policy. (73). 102236.
Izzeldin M., Muradoğlu Y. G., Pappas V., Petropoulou, A., Sivaprasad S. (2023). The impact of the Russian-Ukrainian war on global financial markets International Review of Financial Analysis. (87). 102598.
Lin Z. L., Ouyang W. P., Yu Q. R. (2024). Risk spillover effects of the Israel–Hamas War on global financial and commodity markets: A time–frequency and network analysis Finance Research Letters. (66). 105618.
Mellouli D., Bejaoui A., Jeribi A. (2025). Analyzing quantile and frequency connectedness between natural gas and stock markets amid turbulent times: evidence from G7, BRICS, and Gulf countries Journal of Chinese Economic and Business Studies. (1–41).
Mensi W., Yousaf I., Vo X. V., Kang S. H. (2022). Asymmetric spillover and network connectedness between gold, BRENT oil and EU subsector markets Journal of International Financial Markets, Institutions and Money. (76). 101487.
Ozili P. K. (2025). Impact of the Israel-Hamas War on the global economy. International Relations Dynamics in the 21st Century: Security, Conflicts, and Wars IGI Global Scientific Publishing.
Ozili P. K., Arun T. (2023). Spillover of COVID-19: impact on the Global Economy. Managing inflation and supply chain disruptions in the global economy IGI Global Scientific Publishing.
Samitas A., Kampouris E., Polyzos S. (2022). Covid-19 pandemic and spillover effects in stock markets: A financial network approach International Review of Financial Analysis. (80). 102005.
Sohag K., Husain S., Chukavina K., Al Mamun Md. (2022). Policy Uncertainty, Oil Price, Stock Market and Precious Metal Markets Volatility Spillovers in the Russian Economy Economy of regions. (18(2)). 383 -397. doi: 10.17059/ekon.reg.2022-2-6.
Tan X., Ma S., Wang X., Feng C., Xiang L. (2022). The impact of the COVID-19 pandemic on the global dynamic spillover of financial market risk Frontiers in Public Health. (10). 963620.
Ullah S. (2023). Impact of COVID-19 pandemic on financial markets: A global perspective Journal of the Knowledge Economy. (14(2)). 982-1003.
Wang M., Su Y. (2023). How Russian-Ukrainian geopolitical risks affect Chinese commodity and financial markets? Finance Research Letters. (56). 104179.
Yudaruddin R., Lesmana D., Yudaruddin Y. A., Ekşi̇ İ. H., Başar B. D. (2024). Impact of the Israel–Hamas conflict on financial markets of MENA region–a study on investors’ reaction Journal of Economic and Administrative Sciences.