Two indices of market condition changes based on rating migration matrices
Irmatova E...1,2
1 Russian Presidential Academy of National Economy and Public Administration, ,
2 National Rating Agency, LLC, ,
Статья в журнале
Global Markets and Financial Engineering ()
Аннотация:
The article is dedicated to the study of rating changes under the conditions of critical tendencies in the market with the help of rating transition probability matrices. The author revealed the need for developing a tool for negative market events indication based on the general public’s inability to calculate the existing indicators of the Moody’s Investors Service rating agency. The article introduces two new indices, Migration drift index and Drift Complicated Index, built on the basis of rating migration matrices, to analyze the credit quality of the market and its members. The possibility to use them by all the concerned parties is highlighted. Based on testing of the indices, it is defined that the created indicators have a forecasting power that matches Moody’s indicators and even allow improving their rates in some cases.
Ключевые слова: credit rating, rating migration matrix, rating drift, rating activity
1. Introduction
The ability to determine downward market trends and credit conditions of its members is absolutely relevant for both companies and investors. In 1993, the article by Moody’s Investors Service entitled “Measuring changes in corporate credit quality [1]” was published where two indices (rating activity and rating drift), reflecting the changes in the market condition, were introduced and studied. However, to calculate these indicators, the full statistics of the rating agents regarding the transition that took place are required, but also unavailable to the general public. The absence of data is a barrier for the free use of rating activity and drift indicators; this shows the need to create new indices available for calculation by all individual involved. The new indices are based on rating transition probability matrices.
Rating migration matrice or rating transition matrice characterises the previous changes in credit quality of rating objects. The choice of rating migration indices to create new indices is connected to the fact that they are published with certain intervals in sources, which are open to the general public (on websites of rating agencies).
The testing of the introduced indices using Russian data showed that they described market movements that are no worse than the relevant Moody’s indicators and detect critical market tendencies in a more precise manner.
The work is constituted by 6 sections. The 2nd section will describe the data used in the study, the 3rd section covers the testing of rating activity and drift on the Russian market data, the 4th and the 5th sections present new indices and the 6th section contains the conclusion.
2. Description of the Data
The base for creation of indices and rating transition probability matrices was formed based on the data regarding the reliability and solvency ratings presented by the National Rating Agency [2]. Since January 1, 2006 until January 1, 2015, over 650 companies were studied. The ratings were analysed through categories based on the 23-level rating scale of the rating agency (from AAA to D including intermediary levels +/-). More than 2200 rating events that had happened for 9 years were taken. Rating migration matrices based on all the data were built by two methods: cohort method and duration approach (time-homogeneous case). Detailed description of these methods can be found in articles (Gunnvald, 2014; Berd, 2005; Fiedelius, Lando, Nielsen, 2004, P. 71; Grzybowska, Karwanski, Orłowski, 2010).
It’s noteworthy that rating migration matrices were built for each year separately for study purposes. It also should be specified that separate matrices were built individually for the Agency’s reliability and solvency ratings.
3. Rating Activity and Rating Drift
A change in the credit quality of financial market players is an important criterion to determine the directions of investment (Becker, Milbourn, 2010; Gangolf, Dochow, Schmidt, Tamisier, 2014; Wang, Carson, 2014; An, Nichols, 2014). Like it was referred in the Introduction, the Moody’s Rating Agency presented 2 indicators: the rating activity and the rating drift. The Rating activity (annual) is defined as the relation of actual rating transitions to the number of companies in all rating categories, at the beginning of the period which is under review. In fact, this index is the rate of rating changes of one rating object. The increase or decrease of the accumulated credit quality can be measured according to the rating drift index. The rating drift is the ratio of difference of the aggregate rating upgrades and downgrades to the number of companies rated at the time of the beginning of the period. In this section, we will test the introduced indices using the data which is available to discover the crisis phenomena based on the data from the National Rating Agency for 2006–2014. The indices were built individually for the reliability and solvency ratings.
The positive value of the rating drift is the proof that the number of upgrades exceeds the number of downgrades, which, in its turn, is indication of the improvement of the general credit quality of market players. Accordingly, the negative value indicates a general decrease of companies’ solvency. Tables 1 and 2 show the results obtained for indicators. Based on Table 1, Figure 1 is drawn for illustration of the results (the bars are the rating activity; the line is the rating drift).
Table 1
Indicator (index) analysis based on reliability ratings, 2006–2014
|
|
Number of Upgrades
|
in %
|
Number of Downgrades
|
in %
|
Rating Activity
|
Rating Drift
|
|
2006
|
1
|
25.00%
|
0
|
0.00%
|
25.00%
|
25.00%
|
|
2007
|
5
|
13.16%
|
1
|
2.63%
|
15.79%
|
10.53%
|
|
2008
|
13
|
14.94%
|
1
|
1.15%
|
16.09%
|
13.79%
|
|
2009
|
11
|
9.57%
|
7
|
6.09%
|
15.65%
|
3.48%
|
|
2010
|
20
|
17.86%
|
4
|
3.57%
|
21.43%
|
14.29%
|
|
2011
|
29
|
25.44%
|
3
|
2.63%
|
28.07%
|
22.81%
|
|
2012
|
25
|
18.94%
|
4
|
3.03%
|
21.97%
|
15.91%
|
|
2013
|
30
|
21.74%
|
1
|
0.72%
|
22.46%
|
21.01%
|
|
2014
|
20
|
14.39%
|
5
|
3.60%
|
17.99%
|
10.79%
|
Table 2
Indicator (index) analysis based on solvency ratings, 2008–2014
|
|
Number of Upgrades
|
in %
|
Number of Downgrades
|
in %
|
Rating Activity
|
Rating Drift
|
|
2008
|
3
|
10.00%
|
0
|
0.00%
|
10.00%
|
10.00%
|
|
2009
|
8
|
26.67%
|
0
|
0.00%
|
26.67%
|
26.67%
|
|
2010
|
23
|
28.40%
|
1
|
1.23%
|
29.63%
|
27.16%
|
|
2011
|
12
|
14.46%
|
1
|
1.20%
|
15.66%
|
13.25%
|
|
2012
|
30
|
22.73%
|
1
|
0.76%
|
23.48%
|
21.97%
|
|
2013
|
35
|
16.83%
|
6
|
2.88%
|
19.71%
|
13.94%
|
|
2014
|
30
|
12.15%
|
12
|
4.86%
|
17.00%
|
7.29%
|
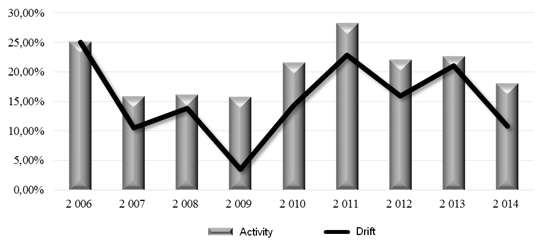
Figure 1. Rating activity and rating drift for the period 2006–2014 according to reliability ratings
It should be highlighted that even during the critical years between 2008 and 2009 the rating drift achieved positive values. This is justified, firstly, by the fact that during the period of 2006–2010 the National Rating Agency was actually gaining sufficient client base and so, generally, ratings were assigned in those years (due to this fact, activity and drift for solvency ratings were reviewed since 2010).
Figure 1 shows that the rating activity in critical years (2007–2009) barely suffered any changes (average 15.8%) and had a quick increase in 2010–2013, i.e. in the period of recovery after the 2008 events. In 2014, sanctions (especially those related to limitation of access to capital markets) affected the financial condition of Russian economic subjects, thus the rating activity started diminishing (by 4.47% if compared with 2013). In addition, it is possible to conclude that the general credit quality of companies decreases under the conditions of critical events judging by the dynamics of rating drift. So, in 2008 the rapid decrease of the gap between rating transitions started and in 2009 it reached its minimum in 3.48%. In 2009, the number of company downgrades increased with a small decrease in the number of upgrades. It’s worth mentioning that this feature appeared both in 2009 and 2014. During the recovery period, i.e. in 2010–2013, the general trend was opposite to the critical one (i.e. the general increase of upgrades at decrease of downgrades).
When it comes to rating activity and rating drift, a strong decrease of rating activity was seen in 2011 (almost by 14 %) that happened due to the decrease of the number of rating upgrades (by 11 transitions). This can be explained by an active recovery of companies in 2011 with a resulting slowdown of the previously mentioned rates. In 2014, the activity decreased (similar to the reliability ratings situation) and the drift decreased by 6.5% and 14.7% respectively (from 2012 to 2014). These events allow understanding the general decrease of solvency of the studied companies when the critical events took place.
In short:
1. Rating activity decreased for reliability and solvency ratings under the conditions of critical market events (2008–2009 and 2014).
2. Rating drift also took minimal values (from the studied part) in the abovementioned years which indicated the general decrease of financial companies’ credit quality.
Thus, we can reach a conclusion that the rating activity and drift describe market movements and can track critical trends.
4. Migration Drift Index ( ![]() )
)
The matter of this section is the introduction of the critical market trends indicator based on rating transition probability matrices. To elaborate this index, 23x23-rating migration matrices of the following form were reviewed
![]() , where i=1,....23, j=1,....23.
(1)
, where i=1,....23, j=1,....23.
(1)
The matrices were calculated by the cohort method and duration approach for 2007–2004 (in 2006 there were few rating events, so the matrix was not created) according to reliability and solvency ratings.
The general increase of rating transition probabilities is a sign of the increase of market players’ credit quality, and the decrease leads to the opposite result. It should be taken into account that such increase of probabilities is possible due to both the increase of rating activity (in the part of upgrades) and in the case when probabilities grow in number.
To
analyse 23–23 matrices M for disclosure of critical market trends, the index ![]() is introduced (Migration drift index), which
is equal to the exponent from the amount of transition probabilities. The
formulae of this functional for calculation according to rating upgrades and downgrades
are given below:
is introduced (Migration drift index), which
is equal to the exponent from the amount of transition probabilities. The
formulae of this functional for calculation according to rating upgrades and downgrades
are given below:
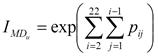 (2)
(2)
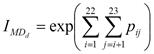 (3)
(3)
where
![]() (Migration drift index for upgrades) and
(Migration drift index for upgrades) and ![]() (Migration drift
index for downgrades) are indexes of rating upgrades and downgrades respectively
(the matrices in the analysis are taken for the period of one year); and
(Migration drift
index for downgrades) are indexes of rating upgrades and downgrades respectively
(the matrices in the analysis are taken for the period of one year); and ![]() are components
of 23x23 rating migration matrices. Accordingly, the more index value we
obtain for upgrades, the better the credit quality is; the less the index value
is – the scantier the solvency is (and vice versa for rating downgrades). Based
on the calculations of the migration drift index Figures 2 and 3 were
obtained (the grey line is the index value for matrices built upon the cohort
method; the black line is for matrices calculated by the duration approach).
are components
of 23x23 rating migration matrices. Accordingly, the more index value we
obtain for upgrades, the better the credit quality is; the less the index value
is – the scantier the solvency is (and vice versa for rating downgrades). Based
on the calculations of the migration drift index Figures 2 and 3 were
obtained (the grey line is the index value for matrices built upon the cohort
method; the black line is for matrices calculated by the duration approach).
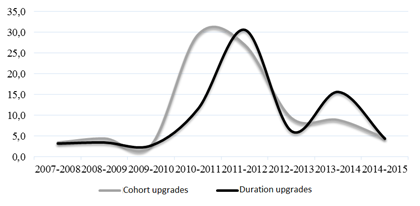
Figure
2. The diagram of
rating upgrade index ![]() (reliability matrices by the
duration approach and the cohort method, 2007–2014)
(reliability matrices by the
duration approach and the cohort method, 2007–2014)
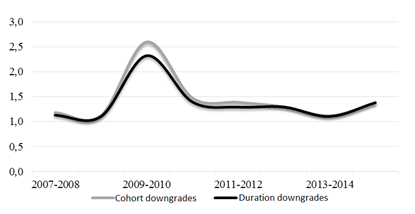
Figure
3. The diagram of
rating downgrade index ![]() (reliability matrices
by the duration approach and the cohort method, 2007–2014)
(reliability matrices
by the duration approach and the cohort method, 2007–2014)
The Figure 2 demonstrates that in the period of 2009–2010, the rating transition probabilities decreased, when compared with 2008 (by 2 transitions) which indicates the general decrease in numeric values of probabilities and, consequently, the decrease in the credit quality of companies. This diagram also shows that during the recovery period, i.e. from 2010 to 2013, the trend of probabilities rapidly goes up – this implies the increase in the quantity and the numeric value of rating upgrade probabilities, i.e. the recovery of solvency of the studied objects. In 2013, the index value calculated by the cohort method suffered a decrease, thanks to the decreased rating transition probabilities, despite the growth of their quantity. However, the quick growth of functional calculated by the duration approach was observed in 2013. It’s required to pay attention to this. The cohort method probably discloses the beginning of critical trends because it covers only the transitions that have actually taken place. In fact, in 2013 the upgrade probabilities rapidly decreased. It’s also important to note that in 2014 (under the critical trends) a sharp decrease of rating upgrade probabilities occurred.
In addition to the upgrades, rating downgrades were also analysed using the migration drift index that is shown in Figure 3. It illustrates the increase of the functional values in the critical years of 2008–2010 as well as in 2014, and, accordingly, its decrease in the recovery periods (2010–2013).
Although
the ![]() index was built according to the data of
matrices based on different calculation methods, the lines in diagrams almost merge
with each other (in the case of downgrade index) or repeat the general trend
(in the case of upgrade index), meaning that the obtained index values are
almost similar. The matrices that were built using the cohort method give
somehow rough evaluation of rating transition probabilities, while the duration
approach specifies them. This explains the small divergence of lines in Figure
3. However, although there are some differences between the methods, it’s possible
to conclude that they generally help to determine the direction of market
movements and the change in the credit quality of players.
index was built according to the data of
matrices based on different calculation methods, the lines in diagrams almost merge
with each other (in the case of downgrade index) or repeat the general trend
(in the case of upgrade index), meaning that the obtained index values are
almost similar. The matrices that were built using the cohort method give
somehow rough evaluation of rating transition probabilities, while the duration
approach specifies them. This explains the small divergence of lines in Figure
3. However, although there are some differences between the methods, it’s possible
to conclude that they generally help to determine the direction of market
movements and the change in the credit quality of players.
The migration drift index was similarly calculated using the solvency rating migration matrices. The results are close to the ones of rating migration matrices upon reliability rating. It was revealed that under prevailing negative trends (2014) the difference between values of migration drift index for rating upgrades and downgrades is rapidly decreased.
Thus,
this section has introduced the ![]() (migration drift) index,
which is capable of indicating the market movement and the critical events, no
worse than the Moody’s indicator (rating drift). Moreover, the analysis of the
index according to the matrices of the cohort method showed that in 2013 the
index value suffered a quick decrease, meanwhile the rating drift showed the
rapid increase. Probably, the index introduced by us has the ability of signing
the negative effects earlier than drift.
(migration drift) index,
which is capable of indicating the market movement and the critical events, no
worse than the Moody’s indicator (rating drift). Moreover, the analysis of the
index according to the matrices of the cohort method showed that in 2013 the
index value suffered a quick decrease, meanwhile the rating drift showed the
rapid increase. Probably, the index introduced by us has the ability of signing
the negative effects earlier than drift.
It’s important to note that the calculation of the migration drift index is available for all those concerned, as rating transition probability matrices (built by the cohort method) are published by the rating agencies with certain intervals.
The next section will show another one feature of rating migration matrices that allows determining market movements and the credit condition of its players.
5. Extended Drift Complicated Index ( ![]() )
)
In
addition to the built ![]() index, the feature of the
rating migration matrix built using the duration approach, was used to analyse the
changes that occurred in the credit quality of market players. What is meant
here is occurrence in such matrices of small probabilities of events that did
not take place in fact, but actually appeared as a result of complex and
continuous monitoring of rating actions. The occurrence of such events
accordingly indicates general upward or downward trends. An increase in the
number of such upgrade probabilities is a sign of improvement of the market
condition and the solvency of its players, while the increase in the number of downgrades
signals the opposite. Tables 3 and 4 present the relevant data on
the number of such probabilities (the number of probabilities was calculated
for upgrades and downgrades).
index, the feature of the
rating migration matrix built using the duration approach, was used to analyse the
changes that occurred in the credit quality of market players. What is meant
here is occurrence in such matrices of small probabilities of events that did
not take place in fact, but actually appeared as a result of complex and
continuous monitoring of rating actions. The occurrence of such events
accordingly indicates general upward or downward trends. An increase in the
number of such upgrade probabilities is a sign of improvement of the market
condition and the solvency of its players, while the increase in the number of downgrades
signals the opposite. Tables 3 and 4 present the relevant data on
the number of such probabilities (the number of probabilities was calculated
for upgrades and downgrades).
Table 3
The number of upgrades and downgrades that didn’t actually take place and calculation of the D parameter based on reliability ratings
|
Reliability
| |||
|
|
Upgrades (+add)
|
Downgrades (+add)
|
D Constant
|
|
2008–2009
|
12.00
|
0.00
|
12.00
|
|
2009–2010
|
4.00
|
7.00
|
-3.00
|
|
2010–2011
|
22.00
|
6.00
|
16.00
|
|
2011–2012
|
16.00
|
4.00
|
12.00
|
|
2012–2013
|
16.00
|
2.00
|
14.00
|
|
2013–2014
|
13.00
|
1.00
|
12.00
|
|
2014–2015
|
8.00
|
2.00
|
6.00
|
Table 4
The number of upgrades and downgrades did not happen in fact and calculation of the D parameter based on solvency ratings
|
Solvency
| |||
|
|
Upgrades (+add)
|
Downgrades (+add)
|
D Constant
|
|
2011–2012
|
7.00
|
1.00
|
6.00
|
|
2012–2013
|
17.00
|
0.00
|
17.00
|
|
2013–2014
|
17.00
|
2.00
|
15.00
|
|
2014–2015
|
18.00
|
10.00
|
8.00
|
These events can be taken into consideration within the context of the change in the credit quality of market players, which interests us. Increase in the number of such probabilities of upgrades is an indicator of the improvement of the market condition and its players’ solvency, while the increase in the number of downgrades means the opposite.
The obtained data shows that under the conditions of the critical events’ (2008–2010 and 2014) the aggregated qualities of upgrades and downgrades (which didn’t actually take place) decreased and increased respectively.
Let
us introduce the index ![]() (extended drift
complicated index) which is equal to the difference between these “imaginary”
probabilities (the difference between the number of upgrades and downgrades;
calculations of the parameter in Tables 3 and 4 – column D)
(extended drift
complicated index) which is equal to the difference between these “imaginary”
probabilities (the difference between the number of upgrades and downgrades;
calculations of the parameter in Tables 3 and 4 – column D)
![]() (4)
(4)
where NU is the number of probabilities of upgrades upon the events that did not happen in fact, ND is the number of probabilities of downgrades upon events that did not happen in fact.
To illustrate the results on the index, let us make the diagram for reliability ratings (Fig. 4).
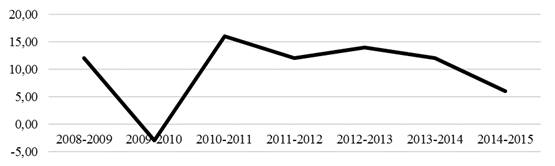
Figure
4. The diagram
of the ![]() index for reliability rating transition
matrices, 2008–2015
index for reliability rating transition
matrices, 2008–2015
It
should be noted that this diagram almost absolutely repeats the diagram of
rating drift (for solvency ratings the result is similar to the obtained one).
It can be said that the index ![]() is the analogue of the
rating drift. The special attention should be paid to the fact that
is the analogue of the
rating drift. The special attention should be paid to the fact that ![]() takes into account several moments in a
more precise manner. For instance, in 2013 the number of upgrades grew but
their probability values fell down; drift didn't appear that but
takes into account several moments in a
more precise manner. For instance, in 2013 the number of upgrades grew but
their probability values fell down; drift didn't appear that but ![]() did. It’s noteworthy that the suggested
drift complicated index is more accurate in comparison with the rating drift
index. Its (drift) calculation is based on quantitative values of upgrades and downgrades.
However, as shown by the data, the total number of rating upgrades doesn't
always mean a significant increase of the credit quality (so, for example, in
2013 there were 13 upgrades, which is more than in all previous periods, but
the accumulated probability of upgrades fell down). This drawback is eliminated
by the use of the parameter
did. It’s noteworthy that the suggested
drift complicated index is more accurate in comparison with the rating drift
index. Its (drift) calculation is based on quantitative values of upgrades and downgrades.
However, as shown by the data, the total number of rating upgrades doesn't
always mean a significant increase of the credit quality (so, for example, in
2013 there were 13 upgrades, which is more than in all previous periods, but
the accumulated probability of upgrades fell down). This drawback is eliminated
by the use of the parameter ![]() , which is sensitive to
such changes.
, which is sensitive to
such changes.
6. Conclusion
This
work introduces 2 new indices based on rating transition probability matrices: Migration
Drift Index
(![]() ) and Extended Drift Complicated Index (
) and Extended Drift Complicated Index (![]() ). Both
indices built according to the data of the National Rating Agency for 2006–2014
reflect market movements and show the results no worse than Moody’s indicators.
). Both
indices built according to the data of the National Rating Agency for 2006–2014
reflect market movements and show the results no worse than Moody’s indicators.
The Migration Drift Index can be calculated by anyone concerned as it’s based on rating transition probabilities published by rating agencies. I.e., this index can become a new instrument for identification of critical market trends with the results no worse than the ones from the Moody’s Rating Agency’s indicators.
The
Extended Drift Complicated Index is built using matrices that are not published
by agencies; but, as it turned out, its movements almost repeat changes in the
rating drift. It should be highlighted that the complicated drift shows the
beginning of negative trends a little earlier than the rating drift. It was
noted that ![]() is more sensitive to qualitative market
changes while the rating drift is based only on the quantitative market
component.
is more sensitive to qualitative market
changes while the rating drift is based only on the quantitative market
component.
Further studies of features of the built indices, as well the features of rating transition probability matrices, are needed to disclose more precise patterns of their behaviour. The used database is the full statistics of the National Rating Agency; however, to make the results obtained in this work mores specific, it’s required to test the disclosed features on the wider statistic base of rating events and transitions.
The author expresses her deep gratitude to K. N. Korishchenko for his constant attention to this work.
[1]Moody’s Investor Services. (1993, November). Measuring Changes in Corporate Credit Quality. Retrieved from: http://www.fonsrisksolutions.com/Documents/1993%20Rating%20Migration%20Study.pdf
[2] Official website of the Natsionalnoe Reitingovoe Agentstvo [National Rating Agency].
Страница обновлена: 22.01.2024 в 21:41:54