
Gold as an instrument for diversifying international reserves of central banks in Asia-Pacific countries
Филина А.Д.1 , Албогочиева А.И.1
1 Финансовый университет при Правительстве Российской Федерации, Москва, Россия
Статья в журнале
Экономические отношения (РИНЦ, ВАК)
опубликовать статью | оформить подписку
Том 17, Номер 1 (Январь-март 2027)
Introduction
International reserves perform several functions for a central bank. They provide foreign currency liquidity, can be used during periods of external pressure and support confidence in a country's ability to meet its international obligations. Their size matters, but their composition matters as well. A reserve portfolio concentrated in a narrow range of currencies and financial instruments remains exposed to changes in exchange rates, interest rates and market conditions. This makes diversification a practical part of reserve management rather than only a theoretical portfolio principle [4].
Gold differs from most traditional reserve assets in several respects. It is not a liability of another government or financial institution and therefore does not carry conventional issuer credit risk. At the same time, this does not make gold risk free. Its price can change considerably, it does not provide regular interest income, and its liquidity is lower than that of the most liquid foreign currency assets. Recent IMF research also stresses that the diversification and hedging properties of gold are not equally strong under all market conditions. For a central bank, the decision to hold gold therefore involves both potential benefits and costs [5].
Interest in this question has increased as central banks have returned to the gold market more actively. Arslanalp, Eichengreen and Simpson-Bell show that official gold holdings started to rise again after the global financial crisis. They identify a group of “active diversifiers” that both purchased additional gold and increased its share in total reserves by at least five percentage points. Their analysis links stronger interest in gold with several factors, including economic and financial uncertainty, relative returns on alternative reserve assets and, for some economies, exposure to financial sanctions. These results are important, but they do not mean that all central banks accumulate gold for the same reason [1].
The distinction between accumulation and valuation has become particularly important in recent years. The market value of official gold holdings may increase because a central bank purchases additional metal, but it may also rise because the gold already held becomes more expensive. The second case does not require any new transaction. This can substantially change the reported structure of a reserve portfolio. IMF estimates show that between 2018 and 2025 the global market value of central bank gold holdings increased much faster than their physical volume. A large part of the increase therefore came from valuation rather than from new accumulation [5].
This creates a problem for comparative analysis. A larger share of gold in total reserves is often interpreted as evidence that a central bank has strengthened its gold position. Sometimes this is correct. But the indicator alone cannot show how the change occurred. Two central banks may end a period with a considerably higher gold share even though one has purchased additional metal and the other has kept its physical holdings unchanged. A third central bank may even reduce its holdings while the market value of the remaining gold rises enough to increase its share in total reserves.
This difference matters for the interpretation of reserve diversification. Physical accumulation reflects an actual change in the amount of gold owned by the monetary authority. Valuation changes the importance of an existing position without necessarily reflecting a new reserve management decision. The share of gold in total reserves captures the final portfolio outcome, but combines both effects. Looking at only one of these indicators may therefore give an incomplete picture.
The Asia Pacific region provides useful cases for examining this issue because central banks in the region have followed noticeably different approaches to gold. This paper considers China, India, Singapore, Thailand, the Republic of Korea and the Philippines over 2015 to 2025. The six countries are not intended to represent the entire region. They were selected for comparative analysis because their reserve portfolios differ considerably in size, their physical gold holdings followed different trajectories, and comparable official statistics are available over the study period.
The purpose of the paper is to assess how and to what extent gold has been used as an instrument for diversifying international reserves in these six countries. The analysis compares changes in the physical amount of gold held by central banks with changes in gold’s share of total international reserves, while also considering the role of market valuation in explaining divergences between these indicators. The main question is not simply whether gold became more important between 2015 and 2025. The more relevant question is whether a similar increase in its portfolio share actually reflected similar reserve management decisions.
The scientific novelty of this paper lies in the comparative analysis of changes in gold reserves across six Asia-Pacific countries over 2015–2025. The paper distinguishes between physical gold holdings and gold’s share in total reserves. It also considers the role of market valuation when these indicators move differently. This makes it possible to identify different paths behind a similar increase in the portfolio share of gold. The results show that a higher gold share may accompany an increase, almost no change or even a decline in physical holdings. The comparison therefore gives a more detailed view of gold diversification than the portfolio shares alone.
This approach makes it possible to compare countries that at first appear to move in the same direction. As the calculations below show, they did not. The difference between physical accumulation and valuation becomes central to explaining why.
Physical gold holdings were measured in tonnes. The data come from the World Gold Council dataset on official gold reserves, which relies mainly on IMF International Financial Statistics and national sources. For each year, the end-of-year observation was used [3, 8].
The six countries hold very different amounts of gold. A direct comparison in tonnes would therefore make the largest holders dominate the results. To avoid this problem, the physical holdings were converted into an index where 2015 equals 100:
PHIᵢₜ = (Qᵢₜ / Qᵢ,₂₀₁₅) × 100
where Qᵢₜ is the amount of official gold held by country i in year t, measured in tonnes.
This index shows whether the physical amount of gold changed during the period. It does not depend on changes in the market price of gold. This difference matters because the dollar value of a central bank's gold reserves can rise even when no additional gold is purchased.
The share of gold in total reserves was taken from the same World Gold Council dataset. We used the same source for both indicators to keep the comparison consistent. The World Gold Council calculates the gold share from the value of gold holdings and total reserves, using reserve statistics based mainly on IMF International Financial Statistics.
The sample includes China, India, Singapore, Thailand, the Republic of Korea and the Philippines. It does not cover the whole Asia Pacific region. The six countries were chosen for comparison because their reserve portfolios differ in size and their physical gold holdings followed quite different paths between 2015 and 2025. Comparable data are also available for the full period.
Table 1 compares the starting and final positions of the six countries. It shows both the change in physical holdings and the change in the share of gold in total reserves. Looking at these indicators together is important because a higher gold share does not necessarily mean that a central bank purchased more gold.
Table 1
Changes in official gold holdings and the share of gold in international reserves of selected Asia Pacific countries, 2015–2025
|
Country |
Gold holdings, tonnes |
Change, % |
Gold share | ||
|
2015
|
2025
|
2015, %
|
2025, %
| ||
|
China
|
1,762.3
|
2,306.3
|
+30.87
|
1.76
|
8.64
|
|
India
|
557.7
|
880.3
|
+57.84
|
5.38
|
17.66
|
|
Singapore
|
127.4
|
193.6
|
+51.93
|
1.72
|
6.29
|
|
Thailand*
|
152.4
|
234.5
|
+53.88
|
3.32
|
11.67
|
|
Republic of Korea
|
104.4
|
104.4
|
+0.05
|
0.97
|
3.36
|
|
Philippines
|
195.9
|
133.0
|
−32.13
|
8.28
|
16.83
|
Source: Authors’ calculations based on World Gold Council data, Quarterly Gold and FX Reserves, Q2 2026 (updated September 2026). URL: https://www.gold.org/download/8052 (date of access: 13.10.2026).
The first comparison already shows that an increase in the share of gold does not necessarily correspond to an increase in its physical quantity. The gold share increased in all six countries between 2015 and 2025. Physical holdings did not. China, India, Singapore and Thailand ended the period with larger reported holdings, while Korea's position was practically unchanged. The Philippines held substantially less gold in physical terms than it had in 2015.
India recorded the largest percentage increase in physical holdings among the countries in the sample, about 57.8%. Thailand and Singapore also ended the period more than 50% above their 2015 levels, although these end point changes hide very different paths. China's physical holdings increased by about 30.9%. The increase was smaller in percentage terms, but China started from a much larger absolute position.
Korea provides a different case. Its holdings were about 104.4 tonnes in both 2015 and 2025. At the same time, the share of gold in total reserves increased from 0.97% to 3.36%. Physical accumulation therefore cannot explain the increase in the portfolio share. The result is more consistent with the effect of changes in the market value of the gold already held and changes in the value of the remaining reserve portfolio.
The Philippines make the distinction even clearer. Physical holdings declined from approximately 195.9 tonnes to 133.0 tonnes, a reduction of about 32.1%. Despite this decline, the share of gold in total reserves increased from 8.28% to 16.83%. A higher gold share in this case clearly cannot be interpreted as evidence of greater physical accumulation.
The difference is not a minor statistical detail. If only the change in the gold share were considered, all six countries would appear to have moved in broadly the same direction. The physical data show a different picture. The sample contains substantial accumulation, almost complete stability and a sizeable reduction. The portfolio outcome may therefore look similar even when the movements behind it are different.
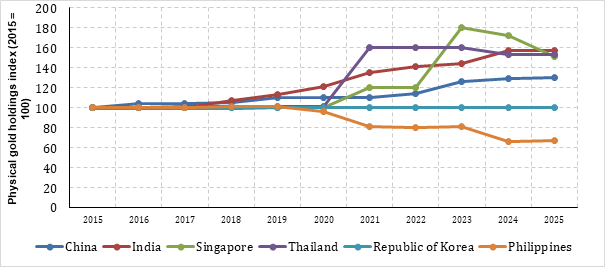
End point comparisons do not show when these changes occurred. Annual physical holdings were therefore converted into an index with 2015 equal to 100. Figure 1 compares the trajectories without allowing the large differences in absolute reserve size to dominate the graph.
Figure 1
Dynamics of official physical gold holdings in selected Asia-Pacific countries, 2015–2025,
2015 = 100
Source: Authors’ calculations based on World Gold Council data, Quarterly Gold and FX Reserves, Q2 2026 (updated September 2026). URL: https://www.gold.org/download/8052 (date of access: 13.10.2026).
The annual trajectories show that changes in physical gold holdings were not uniform across the sample. India followed the clearest pattern of sustained accumulation, although the pace of purchases changed between years. China also accumulated gold over the period, but the process included several years of little or no change and later periods of faster growth. Singapore followed a different path. Its holdings remained unchanged for much of the first half of the period, increased sharply later, and were partially reduced in 2024 and 2025.
Thailand concentrated most of its increase in 2021. Its reported holdings rose from about 154 tonnes in 2020 to approximately 244 tonnes in 2021. The latter part of the Thai series needs more careful interpretation because of the statistical change introduced in 2024. The Bank of Thailand changed the definition of monetary gold so that only gold meeting the required purity threshold was included. The Bank explicitly stated that this adjustment did not change the actual amount of gold it held [2].
Korea remained almost unchanged throughout the period. The Philippine trajectory moved in the opposite direction overall, but the decline was not continuous. Holdings fell particularly strongly in some years, while smaller increases also occurred. By the end of 2025, however, the physical position remained about one third below its 2015 level.
The timing matters because the end point alone hides these differences. Countries that finished the period with a larger role for gold did not reach that position through a common pattern of physical accumulation. This also means that the 2025 portfolio share cannot by itself be used to identify the reserve management process that produced it.
The observed trajectories can be grouped into several patterns. The classification in Table 2 is based on changes visible in the data. It should not be interpreted as an official description of the strategies or motives of the respective central banks.
Table 2
Classification of observed changes in official gold holdings, 2015–2025
|
Observed pattern
|
Countries
|
Main empirical feature
|
|
Sustained accumulation with changing
intensity
|
China, India |
Physical holdings increased over several
years, but the pace was uneven
|
|
Sharp accumulation followed by partial
reduction
|
Singapore |
A large increase occurred later in the
period and was followed by a partial reduction
|
|
Concentrated increase with statistical break |
Thailand |
Most of the increase occurred in 2021;
later comparability is affected by the 2024 reporting change
|
|
Stable physical position
|
Republic of Korea
|
Physical holdings remained almost
unchanged
|
|
Active changes with lower end-period holdings |
Philippines |
Both increases and reductions occurred,
but holdings were substantially lower in 2025 than in 2015
|
The differences between the six countries raise another question. Why did their physical gold holdings move so differently during the same period? The data used in this paper cannot give a complete answer because they show changes in reserve positions, not the motives behind every transaction. Still, several factors help to explain why the role of gold may differ across reserve portfolios.
The starting structure of reserves matters. In 2015, gold accounted for only 0.97% of reserves in Korea and 1.76% in China. In the Philippines, the share was already 8.28%. The countries therefore entered the period from quite different positions. The size of total reserves also differed greatly. For China, even a large purchase of gold may have a limited effect on the portfolio share because the country's total reserve portfolio is much larger. The same physical change could have a stronger effect in a smaller portfolio.
Gold prices are another part of the explanation. Their effect is especially clear in Korea and the Philippines. Korea did not materially increase its physical holdings, but the gold share rose from 0.97% to 3.36%. In the Philippines, physical holdings actually fell by about 32% while the share increased from 8.28% to 16.83%. These two cases would be difficult to explain through physical purchases. Higher market valuation of the gold already held played an important role. Changes in the value of other reserve assets may have affected the ratio as well.
This pattern is not limited to the six countries in the sample. Recent IMF research shows a large difference between the growth in the physical quantity of central bank gold and the growth in its market value. Between 2018 and 2025, the global market value of central bank gold holdings increased by about 268%, while their physical volume rose by only about 8.5%. This does not mean that central bank purchases were unimportant. It shows that price changes can strongly affect the observed role of gold in reserve portfolios [5].
The opportunity cost of holding gold may matter too. Gold does not provide regular interest income in the same way as government securities or deposits. When yields on alternative reserve assets change, the relative attractiveness of gold can change as well. Research by Arslanalp, Eichengreen and Simpson-Bell includes relative returns among the factors associated with central bank gold demand. The authors also consider economic and financial uncertainty and geopolitical risk. These factors provide useful context for the results, but they should not be treated as proven explanations for every transaction in the present sample [1].
Central banks themselves also give several reasons for holding gold. In the World Gold Council's 2025 survey, 85% of respondents considered gold's performance during periods of crisis relevant to their decision to hold it. Portfolio diversification was selected by 81%, while 80% pointed to gold's role as a store of value. The answers do not suggest one dominant motive. Instead, central banks appear to consider several properties of gold at the same time [6].
The individual trajectories in the sample also support a cautious interpretation. Singapore, for example, sharply increased its physical holdings and later reduced part of the position. The Philippines made both sales and purchases during the period. These movements are difficult to describe as a simple one-way shift towards gold. They look more like changes in the way an existing reserve position was managed over time.
Thailand provides one case where some information about the central bank's reasoning is publicly available. When discussing the increase in Thailand's gold holdings in 2021, the World Gold Council reported comments from Bank of Thailand Governor Sethaput Suthiwartnarueput referring to security, return, diversification and tail-risk hedging. This is useful evidence because it points to several considerations rather than one single motive. It should still be treated as evidence for the Thai case, not as an explanation for the other countries in the sample [7].
The Philippine case also gives some evidence of active management. The BSP has made both purchases and sales rather than keeping its physical position fixed. This is important because the lower level of holdings in 2025 could otherwise be read as a simple move away from gold. The annual data show a less straightforward pattern. The quantity declined overall, but the central bank continued to change the position during the period.
Geopolitical risk deserves separate attention because it is often used to explain recent central bank gold purchases. There is some empirical support for this argument. Arslanalp, Eichengreen and Simpson-Bell find an association between financial sanctions and higher gold allocations among some central banks. But this result does not allow us to say that the changes observed in China, India, Singapore, Thailand, Korea or the Philippines were caused by sanctions or by de-dollarisation. The reserve data alone cannot establish that [1].
There is another problem with such an interpretation. An increase in gold holdings does not show which asset was reduced to finance the purchase. Without detailed transaction data and information on the currency composition of reserves, additional gold cannot automatically be treated as a reduction in US dollar assets. For this reason, the results of this paper are better understood as evidence of different forms of reserve diversification rather than direct evidence of de-dollarisation.
The comparison points to a broader conclusion. Gold did not play the same role across the six reserve portfolios, even though its share increased in all of them. In some cases, central banks accumulated substantial physical holdings. In others, the quantity barely changed or declined. Market valuation then widened the difference between physical movements and the final portfolio shares.
This also explains why there is no single indicator that can describe the process on its own. Physical holdings answer one question: did the amount of gold change? Market value answers another: how much was that position worth? The portfolio share adds the size and movement of the rest of the reserves. Looking at the three together gives a more accurate picture of how the role of gold changed between 2015 and 2025.
The analysis shows that gold became a larger part of international reserves in all six countries between 2015 and 2025. At first, this could suggest a broadly similar shift in reserve portfolios. The physical data show that the situation was more complicated.
China and India increased their gold holdings over the period, although the pace of accumulation was not constant. Singapore followed another path. Its holdings remained stable for several years, increased sharply later and were then partially reduced. Thailand concentrated most of its increase in 2021, while the later series is affected by the statistical change introduced in 2024. Korea kept almost the same physical amount of gold throughout the period. The Philippines ended 2025 with about 32% less gold than in 2015, despite some movements in both directions during the period.
These differences are important because the share of gold increased in every country in the sample. Korea and the Philippines are particularly useful examples. Korea's physical holdings were almost unchanged, while the gold share rose from 0.97% to 3.36%. In the Philippines, physical holdings declined from about 195.9 to 133.0 tonnes, but the share increased from 8.28% to 16.83%. A higher portfolio share therefore cannot be treated as direct evidence of additional gold purchases.
The results suggest that three indicators should be considered together. Physical holdings show whether the amount of gold owned by the central bank changed. Market value also reflects changes in the price of gold. The share in total reserves depends on both the value of gold and the size and value of the remaining reserve portfolio. Looking only at the last indicator can hide quite different developments.
The comparison also does not support a single explanation for the changes observed across the six countries. Reserve size and initial portfolio structure differ considerably. Gold prices changed strongly during the period. The relative attractiveness of alternative reserve assets also changed, while uncertainty and geopolitical risk may have influenced some central bank decisions. Existing research supports the relevance of these factors, but the reserve data used here cannot establish the motive behind each individual purchase or sale. For the same reason, the results should not be interpreted as direct evidence of de-dollarisation. An increase in gold holdings does not show which reserve asset was reduced at the same time. Establishing such a relationship would require more detailed data on transactions and the currency composition of reserves.
The study has several limitations. The sample includes six countries and does not represent the whole Asia Pacific region. Annual observations also hide some changes that take place within individual years. In addition, statistical definitions are not always completely stable over time. Thailand provides a clear example, since its definition of monetary gold changed in 2024. These limitations affect how far the results can be generalised, but they do not change the main differences found in the sample.
The main result is therefore quite simple. Gold played a growing role in the reserve portfolios of the selected countries, but this did not happen through one common pattern of physical accumulation. Similar changes in the share of gold were produced by different combinations of purchases, sales, price changes and movements in the rest of the reserve portfolio. For this reason, the role of gold as an instrument of reserve diversification should be assessed through both physical holdings and portfolio indicators rather than through the share of gold alone.
Страница обновлена: 09.11.2026 в 14:23:52
Gold as an instrument for diversifying international reserves of central banks in Asia-Pacific countries
Filina A.D., Albogochieva A.I.Journal paper
Journal of International Economic Affairs
Volume 17, Number 1 (January-March 2027)