Анализ факторов, определяющих уровень технологического развития стран BRICS и G7 в качестве концептуальных положений налоговой политики обеспечения технологического суверенитета
Разу С.Б.1 ![]()
1 Финансовый университет при Правительстве Российской Федерации, Москва, Российская Федерация
Скачать PDF | Загрузок: 40
Статья в журнале
Экономика, предпринимательство и право (РИНЦ, ВАК)
опубликовать статью | оформить подписку
Том 15, Номер 12 (Декабрь 2025)
Эта статья проиндексирована РИНЦ, см. https://elibrary.ru/item.asp?id=89035415
Аннотация:
Предметом исследования выступает совокупность показателей, отражающих уровень технологического развития стран BRICS и G7, взятых из базы данных Всемирного Банка. Целью работы является выявление факторов, оказывающих влияние на уровень технологического развития стран и на основании этого предложение мер по налоговому стимулированию технологического суверенитета России. В рамках модели исследован характер и степень влияния различных социально-экономических факторов стран-членов групп BRICS и G7 на уровень их технологического развития, в качестве основного показателя которого была выбрана доля средне- и высокотехнологичного экспорта в общей структуре промышленного экспорта. По итогам анализа сделан вывод об определяющем влиянии расходов на научно-исследовательские и опытно-конструкторские работы на уровень технологического развития стран объединений.
Ключевые слова: технологический суверенитет, налоговое стимулирование, BRICS, G7, панельные данные, STATA
Финансирование:
Статья подготовлена по результатам исследований, выполненных за счет бюджетных средств по государственному заданию Финуниверситета.
JEL-классификация: O33, O31, O32, L15
Introduction
Understanding what drives the pace and trajectory of technological advancement remains a subject of ongoing debate within the academic community. which highlights the need for a comprehensive, data-driven evaluation of the socioeconomic and scientific-technical determinants that contribute to the expansion of high-technology sectors. Such an assessment is most appropriately conducted through econometric techniques that rely on transparent and publicly accessible statistical datasets.
The world development is characterized, on the one hand, by increased mobility, rapid communication advancements, and deepening international cooperation that strengthen global interconnectedness and encourage countries to coordinate around shared strategic priorities. On the other hand, persistent asymmetries in economic development, escalating competition for global markets, and recurring cycles of overproduction intensify geopolitical and economic tensions. These dynamics often manifest in political confrontations and, in some cases, evolve into military conflicts [5].
Against this backdrop, a comparative assessment of two major geoeconomic blocs – the G7 and BRICS, becomes particularly relevant. The former consists of long-established industrialized nations, whereas the latter includes rapidly developing economies that aspire to redefine the global technological and economic landscape. Understanding how these groups differ in the drivers of technological progress offers valuable insight into the formation of global power balances.
Studying country groupings rather than individual states provides methodological advantages. Aggregated data across blocs reduce the influence of idiosyncratic national, geographic, or institutional features, allowing the analysis to focus on the more fundamental contrast between advanced and developing economies. The “law of large numbers” strengthens the reliability of the results by smoothing irregularities inherent in single-country analyses [4].
BRICS countries
The BRICS group is an alliance of developing countries inclusing Brazil, Russia, India, China, Iran, South Africa, Ethiopia, Egypt, United Arab Emirates and Indonesia. The combined population of these countries constitutes almost 50% of the world's population [2], and their share of global Gross Domestic Product (hereinafter referred to as "GDP"), a significant portion of which is generated by China, exceeds one-third.
According to the World Bank, this indicator exceeded the share of G7 countries for several years now, as clearly shown in Figure 1.
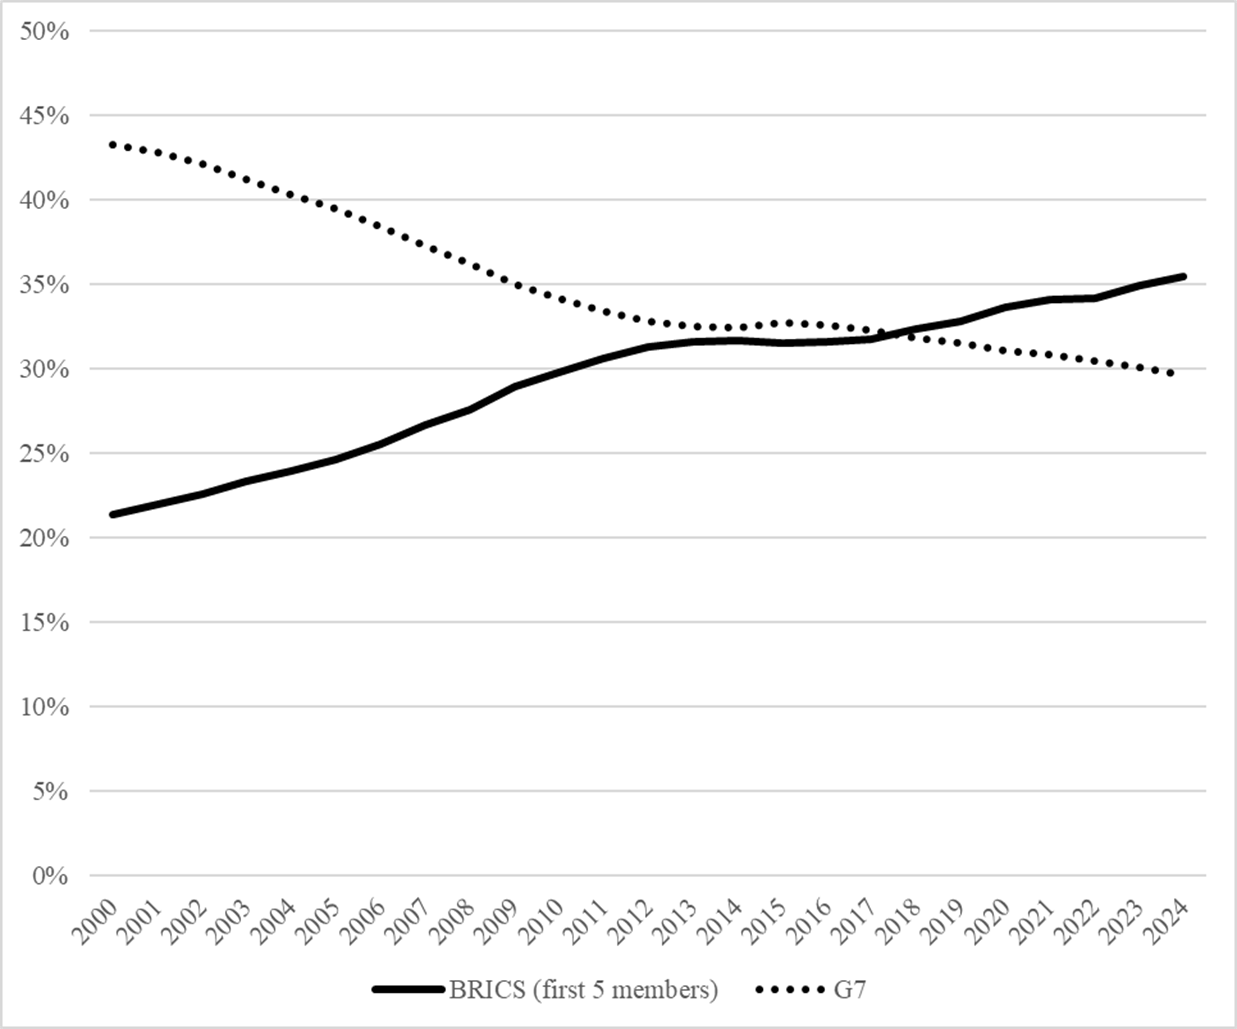
Source: author’s calculations using data obtained from [20]
Figure 1 – Dynamics of the share of unions of countries in global GDP at purchasing power parity by year.
Brief characteristics of the G7 countries
The G7, or "Big Seven," is an informal alliance of developed countries which includes the USA and UK, Canada, France, Italy, Japan and Germany.
The group's formation began in 1975 with informal meetings of the leaders of six leading industrialized countries. Canada joined the following year, expanding the group to seven countries. From 1997 to 2014, Russia also participated in the negotiations, temporarily transforming the format into the G8. However, following the annexation of Crimea and subsequent international sanctions, Russia's participation was suspended [14].
Although the G7 countries' share of the global economy has ceded ground to the combined potential of the BRICS, the G7 countries continue to lead in strategic high-tech sectors and maintain dominant positions in global goods and services markets. The United States remains the largest economy within the G7, holding first place in the number of transnational corporations [12].
At the same time, although the combined real GDP of the BRICS countries exceeds that of the G7, in terms of GDP per capita, developing economies still lag significantly behind [3]. This may indicate a comparatively lower standard of living in the BRICS countries.
Thus, despite the rapid economic growth of BRICS members and their growing influence, the outcome of the rivalry between the two blocs has not yet been determined. The G7 continues to dominate both the global financial architecture and key high-technology industries, which underscores the importance of carrying out a quantitative assessment of the factors that shape technological development across both country groups [8].
Econometric model of BRICS and G7 technological development factors
The analysis draws on information from the World Bank’s Development Indicators database, which provides an extensive array of macroeconomic and industry-specific metrics.
The dependent variable (hereinafter referred to as the "Performance Indicator") was the share of medium- and high-tech exports in each country's total industrial exports, which dynamics are demonstrated in Figure 2.
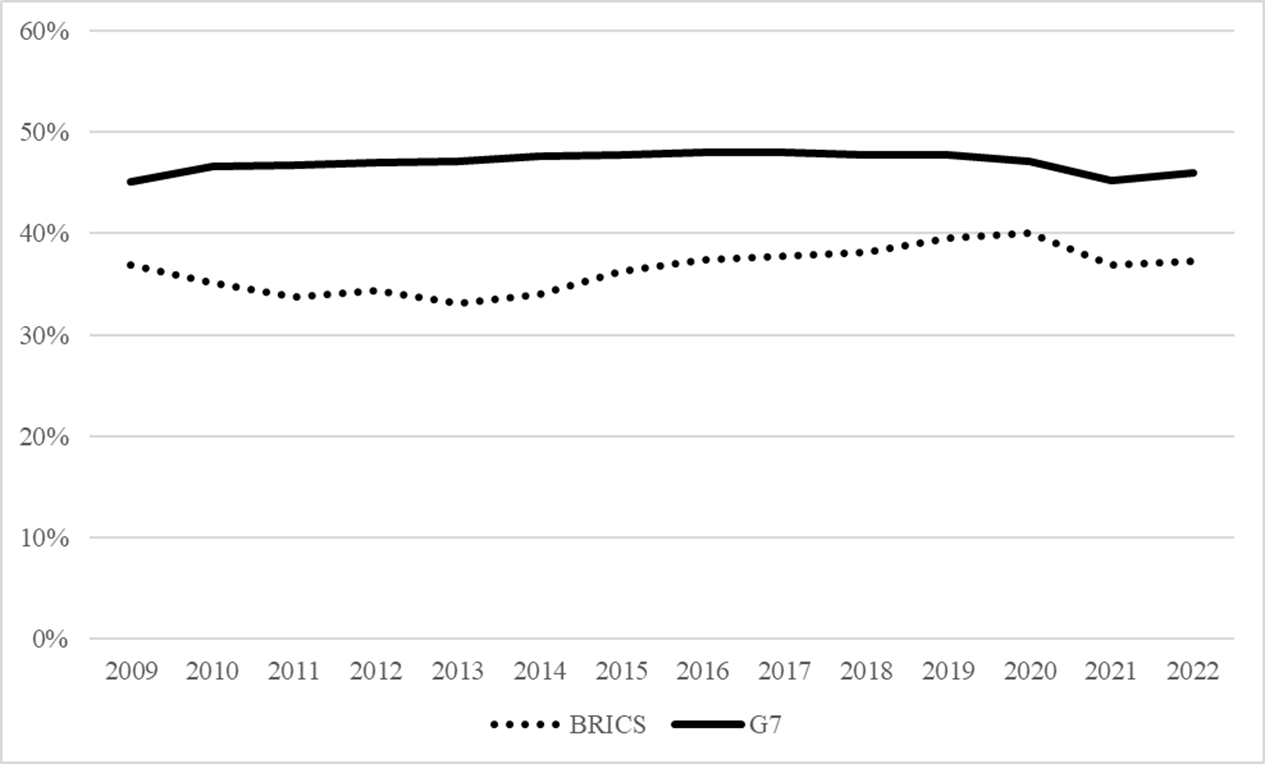
Source: author’s calculations using data obtained from [19]
Figure 2 – Dynamics of the average annual share of medium- and high-tech exports in industrial exports of the associations’ countries.
The study is built on the premise that changes in the dependent variable can be explained by three core regressors (hereinafter the “Regressors”), each extracted from the wide-ranging statistical indicators compiled by the World Bank.
1. The share of research and development (hereinafter referred to as "R&D") expenditure in the GDP structure;
2. The share of subsidies and other transfers in government expenditure (%);
3. The share of military expenditure in total budget allocations.
To study the influence of regressors, two approaches were used:
- Multiple linear regression;
- A panel analysis covering 17 countries from 2009 to 2022.
The use of panel models conditioned by the presence of both temporal and spatial dimensions in the data, which creates the risk of hidden (unobserved) individual effects which are specific characteristics of each country that can correlate with the Regressors and distort the results [1]. For this purpose, two specifications were compared:
- Fixed effects model , which allows individual effects to be correlated with explanatory variables;
- A random effects model that assumes that such effects are independent of the Regressors.
The final equation of the model is described by the following formula:
![]()
Where:
y – Performance Indicator;
i – number of the analyzed state;
t – year under analysis;
β – vector of regression coefficients;
μ – individual effect;
ε – the random error of the model.
All empirical estimations were performed in the STATA environment, a statistical platform that facilitates automated panel model evaluation and greatly enhances the efficiency of the analytical workflow [11].
BRICS analysis
As a preliminary analytical step, the dependent variable was modeled using a simple linear regression framework. After processing the data in STATA and running the .reg function, the estimates were compiled in Table 1.
Table 1 – Linear Regression Assessment of the Impact of the Regressors on the Performance Indicator for BRICS Economies
|
The share of medium- and high-tech
exports in the overall structure of industrial exports
|
Correlation coefficient
|
Pairwise linear regression
coefficient
|
Standard deviation
|
t-statistics
|
Level of significance
|
95% confidence interval
| |
|
R&D expenditure (as % of GDP)
|
0,55
|
0,0654363
|
0,0194814
|
3,36
|
0,001
|
0,0269081
|
0,1039645
|
|
Subsidies and other transfers (as a
percentage of budget expenditures)
|
0,43
|
0,0022702
|
0,0005482
|
4,14
|
0,000
|
0,0011861
|
0,0033543
|
|
Military expenditure (as a percentage of
total government expenditure)
|
-0,37
|
-0,0043892
|
0,0016998
|
-2,58
|
0,011
|
-0,0077509
|
-0,0010275
|
The combined estimates highlight R&D outlays as the most influential driver of improvements in the Performance Indicator, with their impact rated as noticeable on the Chaddock scale. By comparison, military expenditures are negatively correlated with the indicator. All coefficients were statistically significant (p-values < 0.05), confirming the validity of the selected variables. Similarly, the paired linear regression coefficients show the strongest direct relationship between the Performance Indicator and R&D expenditures and an inverse relationship with military expenditures [6].
However, this is insufficient to fully account for hidden factors specific to each country, so the next step was panel models. First, a fixed-effects model was constructed using the .xtreg, fe command, which is shown in Table 2.
Table 2 – Analysis of the influence of Regressors on the Performance Indicator for BRICS countries using a model with individual fixed effects.
|
The share of medium- and high-tech
exports in the overall structure of industrial exports
|
Pairwise linear regression coefficient
|
Standard deviation
|
t- statistics
|
Level of significance
|
95% confidence interval
| |
|
R&D expenditure (as % of GDP)
|
0,0801407
|
0,0187724
|
4,27
|
0,000
|
0,0429908
|
0,1172907
|
|
Subsidies and other transfers (as a
percentage of budget expenditures)
|
0,0038854
|
0,0004851
|
8,01
|
0,000
|
0,0029254
|
0,0048454
|
|
Military expenditure (as a percentage of
total government expenditure)
|
0,0139973
|
0,002992
|
4,68
|
0,000
|
0,0080761
|
0,0199184
|
The overall picture remained the same since R&D expenditures still have the most influence on technology exports, but military expenditures moved to second place in terms of the positive effect, while in a simple regression they demonstrated a negative impact on the Performance Indicator.
To compare a linear regression model and a fixed-effects model, STATA automatically calculates the Wald test. A statistical value of p < 0.01 indicates the need to include fixed effects, indicating that the fixed-effects model describes the data significantly more accurately.
Next, a random effects model (.xtreg, re) was estimated in Table 3.
Table 3 – Analysis of the influence of Regressors on the Performance Indicator for BRICS countries using a model with random individual effects.
|
The share of medium- and high-tech
exports in the overall structure of industrial exports
|
Least squares coefficient
|
Standard deviation
|
t- statistics
|
Level of significance
|
95% confidence interval
| |
|
R&D expenditure (as % of GDP)
|
0,0717912
|
0,0178386
|
4,02
|
0,000
|
0,0368283
|
0,1067542
|
|
Subsidies and other transfers (as a percentage
of budget expenditures)
|
0,0039063
|
0,0004818
|
8,11
|
0,000
|
0,002962
|
0,0048506
|
|
Military expenditure (as a percentage of
total government expenditure)
|
0,0109656
|
0,0027397
|
4,00
|
0,000
|
0,0055959
|
0,0163353
|
The results generated under the random-effects framework were virtually indistinguishable from those derived using the fixed-effects approach, once again confirming the leading role of R&D expenditures in explaining variation in the Performance Indicator. To choose between the two panel models, a Hausman test was used, implemented in STATA using the .hausman command. It tests the hypothesis of no correlation between individual effects and the covariates [17]. Because the p-value is less than 0.01, the hypothesis is rejected, confirming that the fixed-effects approach is better suited to the dataset. This result is logical: the analysis uses a fixed composition of countries, which remained unchanged throughout the entire observation period.
Based on this, in the context of the BRICS countries, the main catalysts for technological development are the relative share of investments in R&D and the volume of military spending.
G7 analysis
The examination of the G7 group proceeded in much the same way. It commenced with a correlation and simple regression analysis performed through the .reg command, the outcomes of which are compiled in Table 4.
Table 4 – Linear Regression Analysis of the Impact of the Regressors on the Performance Indicator in G7 Economies
|
The share of medium- and high-tech
exports in the overall structure of industrial exports
|
Correlation coefficient
|
Pairwise linear regression coefficient
|
Standard deviation
|
t-statistics
|
Level of significance
|
95% confidence interval
| |
|
R&D expenditure (as % of GDP)
|
0,7
|
7,094649
|
0,9286716
|
7,64
|
0,000
|
5,250491
|
8,938807
|
|
Subsidies and other transfers (as a
percentage of budget expenditures)
|
0,47
|
0,2579122
|
0,0766573
|
3,36
|
0,001
|
0,1056859
|
0,4101384
|
|
Military expenditure (as a percentage of
total government expenditure)
|
-0,16
|
-0,6796676
|
0,2040377
|
-3,33
|
0,011
|
-1,084846
|
-0,2744891
|
The results show that in the G7, as in BRICS, R&D expenditures have the greatest direct impact and positive correlation with the Performance Indicator (high by the Chaddock scale), based on the paired linear regression coefficients. All regressors have a statistically significant effect (p < 0.05).
The same sample is then analyzed through a panel fixed effects model (.xtreg, fe) presented in Table 5.
Table 5 – Fixed-Effects Model Analysis of the Impact of the Regressors on the Performance Indicator in G7 Countries
|
The share of medium- and high-tech
exports in the overall structure of industrial exports
|
Pairwise linear regression coefficient
|
Standard deviation
|
t- statistics
|
Level of significance
|
95% confidence interval
| |
|
R&D expenditure (as % of GDP)
|
-1,319369
|
0,8060135
|
-1,64
|
0,105
|
-2,921408
|
0,2826704
|
|
Subsidies and other transfers (as a
percentage of budget expenditures)
|
0,0291349
|
0,084149
|
0,35
|
0,730
|
-0,1381203
|
0,1963901
|
|
Military expenditure (as a percentage of
total government expenditure)
|
0,2164241
|
0,3572648
|
0,61
|
0,546
|
-0,4936784
|
0,9265266
|
The resulting estimates were unexpected: the relationship between the share of high-tech goods in exports and R&D spending was negative, contradicting previous results. Furthermore, none of the coefficients were significant (p > 0.05), calling into question the validity of the model.
To assess the adequacy of the fixed-effects model, a Wald test was used. Its result (p = 0.1185) significantly exceeds the 0.01 threshold, indicating that individual effects for the G7 group do not need to be considered. Therefore, in this case, simple linear regression proves more reliable than the panel fixed-effects model.
Recommendations for Enhancing Tax Incentives to Support Russia’s Technological Sovereignty
Overall, the analysis shows that R&D intensity is a major driver of technological progress in both BRICS and G7 states. The effect is especially pronounced in G7 countries, where high- and medium-technology exports form a significantly larger component of total industrial exports than in BRICS [18]. The results reflect that growing technological potential amplifies the value of R&D spending, reinforcing the argument that fiscal incentives ought to focus foremost on promoting research and development as a fundamental component of technological sovereignty [9].
In the context of this study, it is appropriate to examine the official position of government agencies regarding which technologies are currently a priority for achieving technological sovereignty. According to the "Concept for Technological Development of Russia to 2030," technological sovereignty presupposes “the availability of critical and end-to-end technologies within the country and under its control, as well as its own development pipelines and production conditions based on them, ensuring the sustainable ability of the state and society to achieve their own national development goals and realize national interests” [10].
The list of critical technologies, in turn, has been established by the decree of the President of the Russian Federation [15] and includes such industries as biomedicine, microelectronics, software development, and other innovative areas that are most in-demand in our country. The list of cross-cutting technologies includes artificial intelligence technologies, instrument making, genetic engineering, the chemical industry, and a number of other industries. Under current Russian tax rules, companies may apply a twofold coefficient to R&D expenditures included in a government-approved list when calculating the corporate income tax base [7]. Expanding this framework, it appears justified to introduce a higher coefficient for R&D activities carried out in strategically important technological areas.
According to the Federal Tax Service of Russia's Form 5-P report, in 2023, Russian organizations' R&D expenditures, as defined by the Government of the Russian Federation, amounted to 32 billion rubles. Moreover, over the past 15 years, the average annual growth rate of R&D expenditures, which is demonstrated in Figure 3, was 51.42%.
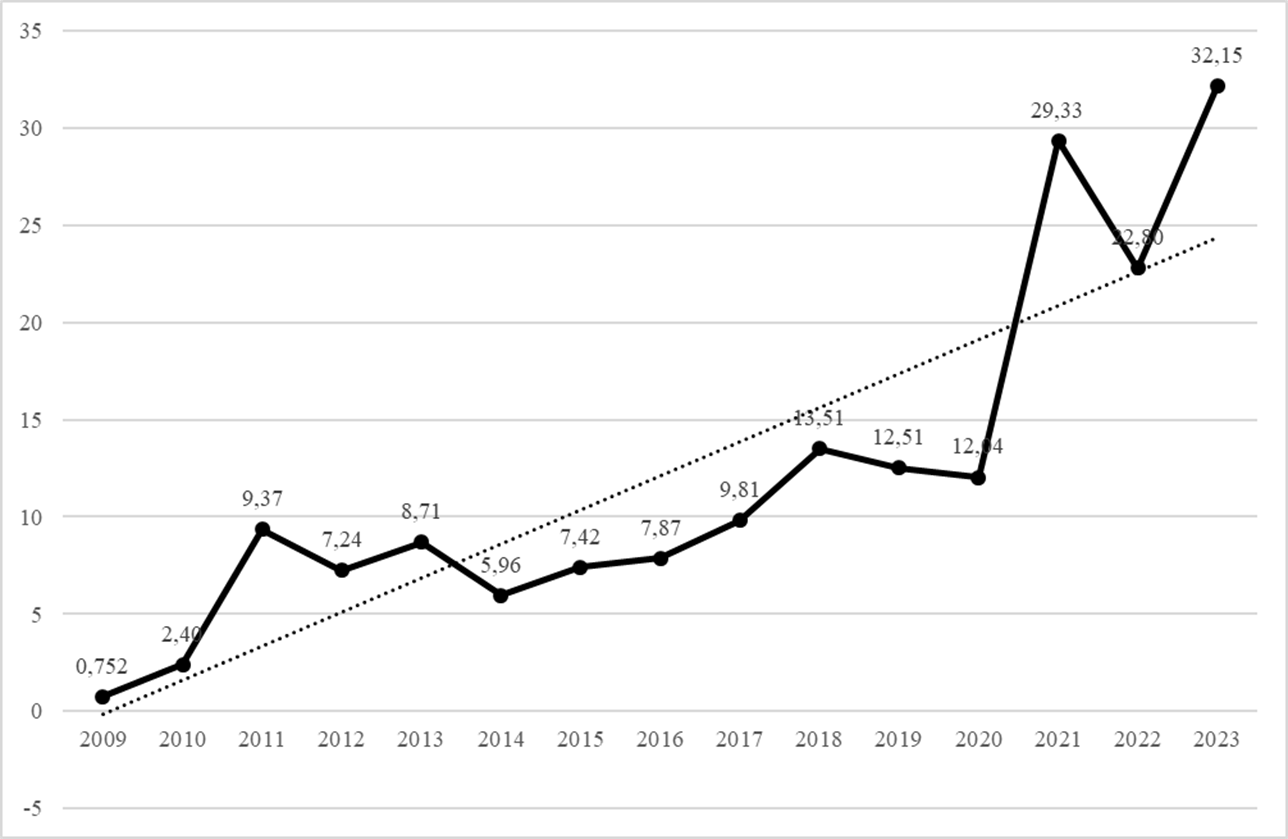
Source: author’s calculations using data obtained from [16].
Figure 3 – Dynamics of R&D expenditures of Russian organizations according to the list established by the Government of the Russian Federation, billion rubles.
As a result, the volume of R&D expenditures of Russian organizations in 2025 can be predicted using the following formula:
![]()
Q – the amount of R&D expenses for the corresponding year, billion rubles;
i – average annual growth rate of R&D expenditure.
By substituting the values into the formula, it is possible to calculate the desired number using the following formula:
![]() bil. rubles
bil. rubles
According to the data from Higher School of Economics, research in sectors directly or indirectly related to the creation of critical and cross-cutting technologies accounted for 30.9% of total R&D expenditure in the Russian Federation [13]. Therefore, by applying a multiplier of 3 to R&D expenditures instead of 2, the amount of lost budget revenue can be calculated using the following formula:
![]()
![]() the volume of lost budget revenues ;
the volume of lost budget revenues ;
s – the fraction of total R&D investment allocated to fields that support, either explicitly or implicitly, the advancement of critical and cross-cutting technological domains;;
![]() – the current coefficient for R&D expenses;
– the current coefficient for R&D expenses;
![]() – the proposed increase
factor for R&D expenses.
– the proposed increase
factor for R&D expenses.
By substituting the values into the formula above, it is possible to obtain the missing amount of budget revenue using the following formula:
![]()
Conclusion
Thus, based on the study's results, a model of the influence of Regressors on the Performance Indicator was constructed. This model revealed the strongest positive correlation and the most significant positive impact of growth in the relative value of R&D expenditures on the growth in the relative volume of high-tech exports in BRICS and G7 countries, which may indicate the decisive role of scientific research in a country's level of technological development. It was also concluded that the most important industries requiring R&D support are critical and cross-cutting technologies.
Accordingly, the study proposes to authorize the triple coefficient for R&D costs in the relevant technological fields, with the aim of reinforcing progress toward national technological sovereignty. To justify this recommendation, a quantitative assessment and projection of the resulting budgetary revenue losses were carried out.
Источники:
2. Евсин, М. Ю. Страны БРИКС в мировой экономике / М. Ю. Евсин, Р. А. Зироян // ЭФО: Экономика. Финансы. Общество. – 2024. – № 4(12). – С. 25-38. – DOI 10.24412/2782-4845-2024-12-25-38. – EDN ARSVCA.
3. Клочкова, О. В. Расширение БРИКС, как тренд многополярности современной мировой экономической системы / О. В. Клочкова, Н. В. Агаркова // Донецкие чтения 2024: образование, наука, инновации, культура и вызовы современности : Материалы IX Международной научной конференции, Донецк, 15–17 октября 2024 года. – Донецк: Донецкий национальный университет, 2024. – С. 265-267. – EDN CBTFQQ.
4. Малаховская, О. А. Исследования причинно-следственных взаимосвязей в макроэкономике: нобелевская премия по экономике 2011 г / О. А. Малаховская, С. Э. Пекарский // Экономический журнал Высшей школы экономики. – 2012. – Т. 16, № 1. – С. 3-30. – EDN OXTZTT.
5. Орлов, А. А. Современные противоречия глобализации мировой экономики / А. А. Орлов // Финансовые рынки и банки. – 2022. – № 6. – С. 145-147. – EDN WOLHDN.
6. Орлов, А. И. Вероятностно-статистические модели корреляции и регрессии / А. И. Орлов // Политематический сетевой электронный научный журнал Кубанского государственного аграрного университета. – 2020. – № 160. – С. 130-162. – DOI 10.21515/1990-4665-160-011. – EDN VBSKPK.
7. Постановление Правительства РФ от 24 декабря 2008 г. N 988 "Об утверждении перечня научных исследований и опытно-конструкторских разработок, расходы налогоплательщика на которые в соответствии с пунктом 7 статьи 262 части второй Налогового кодекса Российской Федерации включаются в состав прочих расходов в размере фактических затрат с коэффициентом 2"
8. Разу, С. Б. Анализ зарубежной практики налогового стимулирования развития высокотехнологичной промышленности / С. Б. Разу // Налоги и налогообложение. – 2024. – № 3. – С. 45-65. – DOI 10.7256/2454-065X.2024.3.70683. – EDN AJQXBV.
9. Разу, С. Б. Становление концептуальных основ и факторов эффективности налогового стимулирования достижения технологического суверенитета / С. Б. Разу // Экономика строительства. – 2024. – № 12. – С. 359-363. – EDN BXAXCR.
10. Распоряжение Правительства РФ от 20.05.2023 N 1315-р «Об утверждении Концепции технологического развития на период до 2030 года»
11. Ратникова Т.А. Анализ панельных данных в пакете STATA. Методические указания к компьютерному практикуму по курсу «Эконометрический анализ панельных данных». М.: ГУ ВШЭ, 2005.
12. Родионова, И. А. Крупнейшие транснациональные корпорации мира: сдвиги в страновой и секторальной принадлежности / И. А. Родионова, Д. А. Дирин // Географический вестник. – 2023. – № 1(64). – С. 52-71. – DOI 10.17072/2079-7877-2023-1-52-71. – EDN LWOZKF.
13. Российские предприятия за 3 года утроили расходы на исследования и разработки [сайт]. – Текст: электронный. – URL: https://www.tadviser.ru/index.php/%D0%A1%D1%82%D0%B0%D1%82%D1%8C%D1%8F:R&D_(%D1%80%D1%8B%D0%BD%D0%BE%D0%BA_%D0%A0%D0%BE%D1%81%D1%81%D0%B8%D0%B8) (дата обращения: 04.10.2025)
14. Рябченко, А. А. Россия и «Group of Seven»: история, перспективы, угрозы взаимодействия / А. А. Рябченко // Актуальные вопросы управления: вызовы и перспективы устойчивого развития : Материалы международной научно-практической конференции, Краснодар, 06 мая 2020 года. – Краснодар: ФГБУ "Российское энергетическое агентство" Минэнерго России Краснодарский ЦНТИ- филиал ФГБУ "РЭА" Минэнерго России, 2020. – С. 293-298. – EDN VIKOAG.
15. Указ Президента Российской Федерации от 18 июня 2024 г. № 529 "Об утверждении приоритетных направлений научно-технологического развития и перечня важнейших наукоемких технологий"
16. Федеральная налоговая служба. Данные по формам статистической налоговой отчётности. [сайт]. – Текст: электронный. – URL: https://www.nalog.gov.ru/rn77/related_activities/statistics_and_analytics/forms/ (дата обращения: 01.10.2025)
17. Хаусман, Д. А. Тесты на спецификацию в эконометрике / Д. А. Хаусман // Прикладная эконометрика. – 2015. – № 2(38). – С. 111-134. – EDN TWGXLD.
18. Храмова, И. Ю. Сравнительная оценка экономических потенциалов стран БРИКС и «Группы семи» / И. Ю. Храмова, Т. С. Морозова // Вестник Алтайской академии экономики и права. – 2024. – № 1. – С. 179-184. – DOI 10.17513/vaael.3230. – EDN EJPPMN.
19. World Development Indicators [сайт]. – Текст: электронный. – URL: https://databank.worldbank.org/reports.aspx?source=world–development–indicators (accessed 16.04.2025)
20. GDP, PPP (current international $). The World Bank. [сайт]. – Текст: электронный. – URL: https://data.worldbank.org/indicator/NY.GDP.MKTP.PP.CD?end=2021&name_desc=true&start=1990&view=chart (дата обращения: 05.03.2024)
Страница обновлена: 17.07.2026 в 08:37:22
Download PDF | Downloads: 40
Analysis of factors determining the level of technological development of BRICS and G7 countries as conceptual provisions of tax policy to ensure technological sovereignty
Razu S.B.Journal paper
Journal of Economics, Entrepreneurship and Law
Volume 15, Number 12 (december 2025)
Abstract:
The subject of the study is a set of indicators reflecting the level of technological development of the BRICS and G7 countries from the database of the World Bank. The article aims to identify factors that affect the level of countries' technological development and propose measures to provide tax incentives for Russia's technological sovereignty.
Within the model, the nature and degree of influence of various socio-economic factors of the BRICS and G7 countries on the level of their technological development were studied. The share of medium and high-tech exports in the overall structure of industrial exports was chosen as the main indicator. Based on the analysis, a conclusion about the decisive influence of R&D expenses on countries' technological development was made.
Keywords: technological sovereignty, tax incentives, BRICS, G7, panel data, STATA
Funding:
The article is based on the results of research carried out at the expense of budgetary funds under the state assignment of the Financial University.
JEL-classification: O33, O31, O32, L15
References:
Babeshko L.O. (2025). METHOD FOR CORRECTING PANEL DATA HETEROGENEITY IN THE MODELS OF COMPLEX ECONOMIC SYSTEMS. Ekonomicheskaya nauka sovremennoy Rossii. 28 (3). 26-36. doi: 10.33293/1609-1442-2025-28(3)-26-36.
Evsin M.Yu., Ziroyan R.A. THE BRICS COUNTRIES IN THE GLOBAL ECONOMY. Ekonomika. (4(12)). 25-38. doi: 10.24412/2782-4845-2024-12-25-38.
GDP, PPP (current international $)The World Bank. Retrieved March 05, 2024, from https://data.worldbank.org/indicator/NY.GDP.MKTP.PP.CD?end=2021&name_desc=true&start=1990&view=chart
Khausman D.A. (2015). SPECIFICATION TESTS IN ECONOMETRICS. Prikladnaya ekonometrika. (2(38)). 111-134.
Khramova I.Yu., Morozova T.S. (2024). COMPARATIVE ASSESSMENT OF THE ECONOMIC POTENTIALS OF THE BRICS COUNTRIES AND THE «GROUP OF SEVEN». Vestnik Altayskoy akademii ekonomiki i prava. (1). 179-184. doi: 10.17513/vaael.3230.
Klochkova O.V., Agarkova N.V. (2024). The expansion of BRICS as a trend of multipolarity in the modern global economic system Donetsk Readings 2024: education, science, innovation, culture and modern challenges. 265-267.
Malakhovskaya O.A., Pekarskiy S.E. (2012). STUDIES OF CAUSE-EFFECT RELATIONSHIPS IN MACROECONOMICS: NOBEL PRIZE IN ECONOMICS IN 2011. Ekonomicheskiy zhurnal Vysshey shkoly ekonomiki. 16 (1). 3-30.
Orlov A.A. (2022). MODERN CONTRADICTIONS OF THE GLOBALIZATION OF THE WORLD ECONOMY. Finansovye rynki i banki. (6). 145-147.
Orlov A.I. (2020). PROBABILITY-STATISTICAL MODELS OF CORRELATION AND REGRESSION. Politematicheskiy setevoy elektronnyy nauchnyy zhurnal Kubanskogo gosudarstvennogo agrarnogo universiteta. (160). 130-162. doi: 10.21515/1990-4665-160-011.
Ratnikova T.A. (2005). Panel data analysis in the STATA package M.: GU VShE.
Razu S.B. (2024). ANALYSIS OF FOREIGN PRACTICE OF TAX INCENTIVES FOR THE DEVELOPMENT OF HIGH-TECH INDUSTRY. Nalogi i nalogooblozhenie. (3). 45-65. doi: 10.7256/2454-065X.2024.3.70683.
Razu S.B. (2024). FORMATION OF CONCEPTUAL BASIS AND FACTORS OF EFFICIENCY OF TAX INCENTIVES TO ACHIEVE TECHNOLOGICAL SOVEREIGNTY. Ekonomika stroitelstva. (12). 359-363.
Rodionova I.A., Dirin D.A. (2023). The largest world's transnational corporations: shifts in countries' and sectors' affiliation. Scientific periodical journal Geographical Bulletin. (1(640). 52-71. doi: 10.17072/2079-7877-2023-1-52-71.
Ryabchenko A.A. (2020). Russia and the Group of Seven: history, prospects, and threats of interaction Current management issues: challenges and prospects for sustainable development. 293-298.
World Development Indicatorsdatabank.worldbank.org. Retrieved from https://databank.worldbank.org/reports.aspx?source=world–development–indicators