Russia’s intra-industry trade in travel services: specifics and intensity
Samarina A.S.1, Wang Shaoyuan1
1 Dongbei University of Finance and Economics
Скачать PDF | Загрузок: 3
Статья в журнале
Экономические отношения (РИНЦ, ВАК)
опубликовать статью | оформить подписку
Том 10, Номер 4 (Октябрь-декабрь 2020)
Цитировать:
Samarina A.S., Wang Shaoyuan Russia’s intra-industry trade in travel services: specifics and intensity // Экономические отношения. – 2020. – Том 10. – № 4. – С. 1503-1524. – doi: 10.18334/eo.10.4.110907.
Эта статья проиндексирована РИНЦ, см. https://elibrary.ru/item.asp?id=44491663
Аннотация:
The paper explores Russia’s intra-industry trade in travel services, using the international trade methods, in particular the Grubel-Lloyd index and methodology proposed by Fontagné and Freudenberg. The study attempts to investigate the specifics and intensity of Russia’s intra-industry trade in travel services over a period from 2002 to 2018 in relation to the world and nine chosen important partners. The result confirms a connection between international trade theories and tourism, and the prevalence of vertical intra-industry trade in Russia’s foreign trade in travel services with selected countries
Ключевые слова: trade in services, intra-industry trade, travel services, tourism
JEL-классификация: L81, L83, F14
1. Introduction
In recent years, tourism has become a vital force driving global economic growth, as it significantly contributes to GDP earnings of many countries and generates employment opportunities [1] (Holjevac, 2003). World Travel and Tourism Council (WTTC) reported that in 2019 the travel & tourism's share accounted for 10.3% of global GDP. The sector created 1 in 10 jobs around the world (330 million jobs) [2]. According to the United Nations World Tourism Organization (UNWTO), the total number of inbound tourists in 2019 was around 1.5 billion, an increase of 3.8% on the previous year [3]. So far, global inbound tourism has achieved consecutive growth for ten years, setting a new record since the 1960s. In 2019, due to factors such as the global economic downturn, the rise of trade protectionism, the surge of nationalism in some regions, and other factors, the growth rate of global inbound tourism had also slowed down. However, despite that, growth in arrivals in most regions of the world was relatively stable and continues to outpace the world economy (3%). Except for the low growth rate of inbound tourism in the Americas, which was only 2%, other regions had grown at a rate higher than the global average (3.8%). Despite occasional random fluctuations, which possibly can be caused by political and economic crises, terrorist attacks, or disease outbreaks, tourism has shown steady growth over time, which undoubtedly confirms the strength and sustainability of the sector. Tourism, traditionally measured by international arrivals and international tourism receipts, is a substantial component of international trade in services [4] (Ferro-Luzzi, Flückiger, 2003).
According to WTTC, Russia undoubtedly can become one of the leading countries in the field of tourism due to an unprecedented number of natural attractions, rich national, cultural, and religious diversity, and a long history [5]. After the USSR collapsed, the country has initiated the long process of economic reforms and trade liberalization, which lasts to the present days. Although the contribution of travel and tourism to the GDP of Russia was only 4.8% in 2018 (average global 10–13%) [6], the government has already realized its priority role in reorienting the economy of the country.
Although nowadays a lot of attention is given to problems of international intra-industry trade, most of the research in this area is conducted in relation to the trade in goods. Trade in services is still a new research subject. There is a lack of studies on Russia’s intra-industry trade in services. To our knowledge, the present study for the first time addresses the subject of Russia's intra-industry trade in services, particularly travel services. The objective of this paper is to analyze Russia’s foreign trade in travel services, using international trade methods, in particular intra-industry trade indices. The study attempts to investigate the intra-industry trade specifics and trade patterns of Russia’s trade in travel services with nine selected important trade partners over a period from 2002 to 2018. By analogy to trade in goods, we expect to confirm the correlation between new theories of international trade and tourism, detected by Leitao [7] (Leitão, 2011), and the prevalence of vertical type of intra-industry trade in Russia’s trade in travel services.
2. The nature of intra-industry trade and trade in services.
Any trade between two countries can be described as inter-industry if flows related to different product groups predominate or intra-industry if simultaneous export and import occur within the same industry in a given time.
The intra-industry trade (IIT) phenomenon was described for the first time by Verdoorn (1960) and named by Balassa (1966) [8, 9] (Verdoorn, 1960; Balassa, 1966). Helpman and Krugman (1985) made the major contribution to developing the concept of IIT, associating it with product differentiation, imperfect competition, and increasing returns of scale [10] (Helpman, Krugman, 1985).
Empirical studies show that geographical distance and trade imbalances discourage intra-industry trade [7, 11–13] (Leitao, 2011; Leitao, 2012; Ledgerwood, Ekanayake, Halkides, 2006; Nowak, Petit, Sahli, 2012). Trade restrictions also negatively affect the volume of IIT [14, 15] (Martin-Montaner, Rios, 2002; Zhang et al., 2005), while trade intensity and level of per capita income have a positive impact on it [12] (Ledgerwood et al., 2006).
The volume of intra-industry trade grows along with the diversification of the economy and trade liberalization. [16] (Ding, 2016). The predominance of IIT in the trade structure for a commodity group emphasizes the importance of specialization, marketing, and product differentiation [17] (Bojnec, 2004). Developed countries with more specialized trade structures usually have higher shares of intra-industry trade [18] (Sharma, 2000). The intra-industry trade’s analysis is an important measure to identify industries that have advantages in the new trade realities. The volume of intra-industry trade reflects the nature of economic integration between countries [19] (Ishchukova, Smutka, 2014) and is of undoubtful importance in making trade decisions.
Researchers of intra-industry trade in recent years attach great importance to its differentiation into two types: horizontal and vertical. Horizontal IIT refers to the exchange of homogeneous goods (or services) with similar quality, but different other characteristics, while vertical IIT refers to trade in goods (or services) differentiated by qualities. Trade parties’ policies and decisions differ depending on the prevailing type of IIT.
Horizontal IIT is a characteristic of trade between partners with similar per capita incomes and factor endowments, while vertical IIT, on the contrary, more often occurs between partners with a larger difference in incomes (demand-side differences) and factor endowments (supply-side differences) [20, 21] (Falvey, Kierzkowski, 1985; Jambor, 2013).
Several researchers have noticed that most intra-industry trade belongs to the vertical type [22–26] (Aturupane et al., 1999; Fontagné et al., 2006; Gabrish, 2006; Hurley, 2003; Kaitila, 1999) and explained by classical theories based on differences in endowments. In turn, horizontal intra-industry trade is usually explained by the model of imperfect competition and scale economies [27, 28] (Ando, 2006; Fainstein, Netsunajev, 2011). Nowak et al (2012) specified that vertical IIT is always dominant in intra-tourism trade [13] (Nowak et al., 2012).
Trade in services was formally included in the theoretical framework of international trade in the mid-1980s. Hindley and Smith (1984) for the first time found that the standard toolkit and principles of international economics are applicable to trade in services [29] (Hindley & Smith, 1984). Afterwards, the first theoretical research on the phenomenon of intra-industry trade in the service industry was conducted by Kierzkowski (1986) [30] (Kierzkowski, 1986). Lee & Lloyd (2002) proposed a solution for measuring the intra-industry trade in service trade using the same method as for measuring trade in goods [31] (Lee, Lloyd, 2002). Similar to intra-industry trade in goods, IIT in services takes place when trading partners simultaneously import and export the same or similar services. For international travel services between the two countries, it means that country A exports travel services to country B and simultaneously imports travel services from country B.
3. Literature review
Although there has been extensive interest in the area of intra-industry trade, the majority of theoretical and empirical studies traditionally have examined the trade in goods. However, as the services sector's share in international trade increases, so does the research interest to trade in services [32] (Samarina,Wang, 2018). Having conducted the review of previous studies, we can divide studies related to intra-industry trade in services into three categories: region-specific research [33, 31, 34] (Linders, 2001; Lee, Lloyd, 2002; Shelburne, Gonzalez, 2004), bilateral trade research [15, 35, 32] (Zhang et al., 2005; Sichei et al., 2007; Samarina, Wang, 2018), and service-specific research [30, 36–42] (Kierzkowski, 1989; Tang, 1999, 2003; Francois, Wooton, 2001; Li et al, 2003; Moshirian et al., 2005; Webster, Hardwick, 2005; Blaskova, Skultety, 2015). In the service-specific research direction, intra-industry trade in travel services was studied by Webster et al., Hu et al., Leitao, Nowak et al., Hanna et al. [43, 44, 7, 11, 13, 45] (Webster et al., 2007; Hu et al., 2008; Leitao, 2011; Leitao, 2012; Nowak et al., 2012; Hanna et al., 2015).
Among the previous studies on Russia’s intra-industry trade, we can note the following ones.
Algieri (2004) studied changes in models of trade specialization in Russia for the period from 1993 to 2002 using the Aquino and Grubel-Lloyd indices [46] (Algieri, 2004). According to the results, specialized intra-industry trade prevails in Russia and seems to have intensified over time. Gusev’s research (2007) showed that the highest intensity of intra-industry trade is a characteristic of Russia’s trade with the CIS (Commonwealth of Independent States) countries and China [47] (Gusev, 2007). Gurova and Efremova (2012) also found a higher share of intra-industry trade in the foreign trade of the CIS countries with the Commonwealth partners. The share of intra-industry trade in trade with partners in the CIS for most countries significantly exceeded the same indicator calculated for trade with the rest of the world. Results also showed that the countries of the so-called “integration core” (Russia, Belarus, and Kazakhstan) are characterized by the highest share of intra-industry trade in commodity circulation [48] (Gurova and Efremova, 2012).
However, all the studies mentioned above were carried out mainly in relation to Russia’s foreign merchandise trade. There is a lack of studies on Russia’s foreign trade in services and, in particular, travel services.
4. Data and methodology
The study analyses the level of intra-industry trade in Russia’s foreign trade in travel services over the period 2002–2018. The analysis is performed in relation to world and nine chosen important trade partners. These are Ukraine, Kazakhstan, China, Finland, Azerbaijan, Poland, Germany, USA, and Egypt.
First seven countries mentioned above are the top seven largest sources of inbound tourists to Russia (by arrivals), accounting for 68% of total international visitors in 2018 (Figure 1).
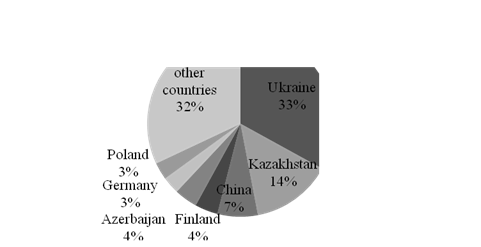
Figure 1. Top 7 Sources of Visitor Arrivals to Russia, 2018
Source: Unified Interagency Information Statistical System of Russian Federation, 2020, authors’ calculations. Retrieved from: https://www.fedstat.ru/indicator/59466. Date of access 01.06.2020.
We also chose the USA and Egypt (although their arrivals numbers are much less), so we can perform analyses concerning trading partners from different regions (CIS, European Union, Africa, Asia, and Americas).
Ukraine, Kazakhstan, and Azerbaijan represent CIS countries (Ukraine as a party of the Creation Agreement), with shares in the total Russia’s export of travel services in 2018 of 8%, 8%, and 3%, respectively [49]. All three countries are in the top 5 sources of visitor arrivals to Russia, which can possibly be explained by the fact that all of them are former USSR countries, whose citizens often come to Russia to visit relatives and find employment opportunities.
China ranks third in the structure of the inbound flow to Russia with a share of 7% in 2018. According to the Russia’s Border Control Service, since 2015, the number of Chinese tourists exceeded 1 million every year [50]. 1690 thousand arrivals from China accounted for 7% of Russia's export of travel services in 2018 [49].
Finland, Poland, and Germany are Russia's primary sources of inbound tourists from the EU, with Germany being one of the largest consumer of Russia’s travel services with a share of 9% in Russia's total export of travel services in 2018 [49].
USA (5% share in the Russia’s export of travel services) represents the Americas and Egypt represents Africa. For more than ten consecutive years, Egypt held one of the largest shares in Russia’s import of travel services, but its share in the Russia’s export was less than 1% [49]. However, Egypt still provides the most significant number of tourist arrivals to Russia from Africa.
The data have been collected from the United Nations (UN) Comtrade database, Unified Interagency Information Statistical System of Russian Federation (UIISS), UNWTO Compendium of Tourism Statistics, the yearbooks of China tourism statistics, National Travel and Tourism Office of the USA (NTTO), State Statistical Committee of the Republic of Azerbaijan, Agency of Statistics of the Republic of Kazakhstan, Administration of State Frontier Service of Ukraine.
Various researchers have proposed several indices to measure IIT, for example, Verdoorn index, Balassa index, or Michaely index, but most of the empirical literature uses the one proposed by Grubel and Lloyd (1975) [51] (Grubel, Lloyd, 1975) as a standard tool for measuring intra-industry trade [34] (Shelburne, Gonzalez, 2004).
Grubel-Lloyd (GL) index calculates the part of balanced trade between two countries in total trade of a given industry. Taking into consideration only one industry (here the focus is drawn to Russia’s travel services), the geographic aggregate GL index is measured as:
![]() ,
,
where
![]() (
( ![]() )
is the value of export (import) in service industry k (in this study k stands
for travel services); and i and j are trading partners (in this study i stands
for Russian Federation and j stands for one of the chosen trading partners or
the world).
)
is the value of export (import) in service industry k (in this study k stands
for travel services); and i and j are trading partners (in this study i stands
for Russian Federation and j stands for one of the chosen trading partners or
the world).
The value of the index lies between 0 and 1. A higher value indicates a larger share of balanced trade in the total volume of trade in travel services at the bilateral level. An index value of 1 suggests the existence of perfect intra-industry trade in travel services, and the opposite is true for a value of 0 (exclusive inter-industry trade).
However, GL index only witnesses the degree of trade overlap, but doesn’t show the differentiation between one-way and two-way trade [52] (Anderson, 2003). Taking this into account and in order to avoid inaccuracies, in this paper, we also use Fontagné and Freudenberg method of intra-industry trade analysis.
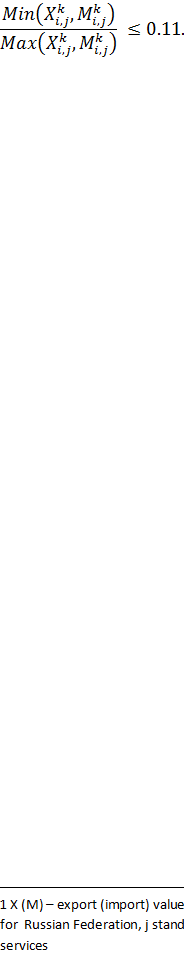
In 1997, Fontagné and Freudenberg, proposed an alternate method to measure intra-industry trade, based on a methodology elaborated by Abd-El-Rahman [53, 54] (Abd-El-Rahman, 1986a; Abd-El-Rahman, 1986b). In this approach, trade can be either "two-way" (intra-industry) or "one-way" (inter-industry). In "two-way" (intra-industry) trade, minority flow is at least x% of majority flow. Otherwise, the trade is “one-way” (inter-industry) [55] (Fontagné, Freudenberg, 1997). Thus, trade is considered to be "two-way" (intra-industry) if:
 ,
,
where X (M) is export (import) value for the good or service k; i and j are trade partners [1] with x% being an arbitrary benchmark, x can take many different values to perform sensitivity tests. Fontagné and Freudenberg (1997, 2002), Fontagné, Freudenberg and Gaulier (2005), and Fontagné, Freudenberg and Péridy (1997, 1998) assumed that x = 10, here in this study x also takes the common value of 10.
The method of disentangling horizontal and vertical trade flows, based on unit-price differentials, has been proposed by Abd-el-Rahman in 1991 (threshold method) [56] (Abd-El-Rahman, 1991). A product shows horizontal differentiation if the unit values (UV) ratio lies within a certain range and vertical differentiation if it lies outside the range.
![]() ,
,
where ![]() (
( ![]() )
is the unit value of export X (import M); i and j are trade partners; α is a
threshold value.
)
is the unit value of export X (import M); i and j are trade partners; α is a
threshold value.
Following Abd-el-Rahman (1991), Fontagné and Freudenberg (1997) proposed a two-stepped methodology to disentangle trade flows into 3 different types: one-way trade, two-way trade horizontally differentiated, and two-way trade vertically differentiated [55]. Some researches name this methodology the decomposition-type threshold method [27] (Ando, 2006). In our study we are going to use this methodology to disentangle flows on bilateral level of trade, following two steps mentioned above:
(1) Flows are considered to be one-way (OWT) if the following equation holds (otherwise the trade is intra-industry):
(2)Remaining flows are regarded as horizontally differentiated (TWTH) if :
![]() ,
,
and
as vertically differentiated (TWTV) otherwise. For
this research calculations are based on the tourism industry. ![]() (
( ![]() )
are the unit values of export X (import M); i and j denote,
respectively, Russian Federation and one of its trading partner, α is a
threshold value. The most frequently used thresholds
are α=15% and 25% [56, 22, 57, 55, 58–60] (Abd-El-Rahman, 1991; Aturupane
et al., 1999; Azhar, Elliott, 2006; Fontagne, Freudenberg,
1997; Fontagne, Freudenberg, 2002; Greenaway et al., 1994; Greenaway
et al.,1995). The first option is more often used in the analysis of trade
between a small number of countries with a similar level of development. Most
studies where the object is the large groups of countries with different
development levels, use α = 0.25. Here α also
sticks to 0.25.
)
are the unit values of export X (import M); i and j denote,
respectively, Russian Federation and one of its trading partner, α is a
threshold value. The most frequently used thresholds
are α=15% and 25% [56, 22, 57, 55, 58–60] (Abd-El-Rahman, 1991; Aturupane
et al., 1999; Azhar, Elliott, 2006; Fontagne, Freudenberg,
1997; Fontagne, Freudenberg, 2002; Greenaway et al., 1994; Greenaway
et al.,1995). The first option is more often used in the analysis of trade
between a small number of countries with a similar level of development. Most
studies where the object is the large groups of countries with different
development levels, use α = 0.25. Here α also
sticks to 0.25.
For the purpose of this study unit values of export (import) are calculated as follows:
![]() ;
;
![]() ,
,
where ![]() )
is the unit value of export X (import M) of k (travel services), i stands for
Russian Federation; j stands for one of the 9 selected important trade partners;
LOS is an average length of stay in i and j respectively.
)
is the unit value of export X (import M) of k (travel services), i stands for
Russian Federation; j stands for one of the 9 selected important trade partners;
LOS is an average length of stay in i and j respectively.
The average length of stay plays a significant role in measuring international tourism worldwide. It determines the total number of nights spent by foreign tourists in different types of accommodation establishments at the destination point [61] (Gössling et al., 2018). UNWTO Compendium of Tourism Statistics provides datasets regarding the average length of stay indicator for a large number of countries. Unfortunately, regarding the Russian Federation, the dataset provided by UNWTO is incomplete due to the lack of correspondence between the Russian system of statistical indicators and international standards of tourism statistics. The data availability on the average length of stay in regard to the Russian Federation was confirmed only for several years; therefore, our research concerning vertical and horizontal IIT is partly limited by the availability of data (individual years missing).
5. Results and discussion
For the purpose of this paper, to analyze the intensity of Russia’s intra-industry trade in travel services, we first calculated the Grubel and Lloyd index in relation to the whole world (Figure 2).
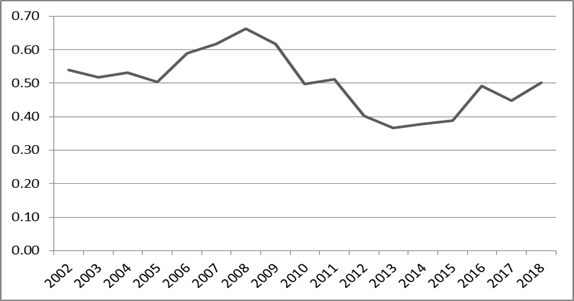
Figure 2. GL index for Russia’s foreign trade in travel services in relation to the world
Source: UN Comtrade Database, 2020, authors’ calculations. Retrieved from: https://comtrade.un.org/data. Date of access 01.06.2020.
As we can see from figure 2, it is not possible to determine a clear trend for the development of Russia’s intra-industry trade in travel services. For the first half of the analyzed period, the index value was generally increasing, reached its maximum of 0.66 in 2008, and then started to decline, reaching its minimum of 0.37 in 2013, and started to rise again in 2014. The average GL index for 17 years was around 0.5, which means the medium intensity of intra-industry trade in travel services. The fluctuations can be explained by many factors that influence bilateral tourism flows, such as government policies, visa, and transport policies, exchange rates, price level, or any other factors which substantially increase the cost of an international trip, etc.
The second step is to examine Russia’s intra-industry trade in travel services at the bilateral level with chosen trading partners.
Table 1
GL index of Russia’s trade in travel services in relation to chosen countries
|
|
Ukraine
|
Kazakhstan
|
China
|
Finland
|
Azerbaijan
|
Poland
|
Germany
|
USA
|
Egypt
|
|
2002
|
n/a
|
n/a
|
0.34
|
0.40
|
n/a
|
0.79
|
0.63
|
0.92
|
n/a
|
|
2003
|
n/a
|
n/a
|
0.33
|
0.38
|
n/a
|
0.98
|
0.53
|
0.99
|
0.01
|
|
2004
|
n/a
|
n/a
|
0.52
|
0.36
|
n/a
|
0.82
|
0.54
|
0.99
|
0.01
|
|
2005
|
0.64
|
0.98
|
0.47
|
0.30
|
0.81
|
0.64
|
0.54
|
0.93
|
0.01
|
|
2006
|
0.85
|
0.90
|
0.61
|
0.30
|
0.77
|
0.69
|
0.69
|
0.96
|
0.01
|
|
2007
|
0.83
|
0.96
|
0.56
|
0.34
|
0.74
|
0.90
|
0.70
|
0.99
|
0.01
|
|
2008
|
0.92
|
0.87
|
0.59
|
0.33
|
0.62
|
0.94
|
0.69
|
0.94
|
0.01
|
|
2009
|
0.81
|
0.87
|
0.80
|
0.33
|
0.66
|
0.87
|
0.63
|
0.80
|
0.01
|
|
2010
|
n/a
|
n/a
|
0.72
|
n/a
|
n/a
|
n/a
|
n/a
|
n/a
|
n/a
|
|
2011
|
n/a
|
n/a
|
0.71
|
n/a
|
n/a
|
n/a
|
n/a
|
n/a
|
n/a
|
|
2012
|
0.55
|
0.92
|
0.72
|
0.37
|
0.73
|
0.99
|
0.43
|
0.45
|
0
|
|
2013
|
0.54
|
0.81
|
0.78
|
0.29
|
0.71
|
0.87
|
0.40
|
0.41
|
0.01
|
|
2014
|
0.60
|
0.73
|
0.79
|
0.34
|
0.75
|
0.87
|
0.41
|
0.36
|
0.01
|
|
2015
|
0.46
|
0.44
|
0.75
|
0.26
|
0.76
|
0.95
|
0.36
|
0.30
|
0.01
|
|
2016
|
0.51
|
0.53
|
0.74
|
0.33
|
0.73
|
1.00
|
0.54
|
0.51
|
0.09
|
|
2017
|
0.21
|
0.39
|
0.72
|
0.26
|
0.51
|
0.96
|
0.51
|
0.50
|
0.11
|
|
2018
|
0.22
|
0.40
|
0.87
|
0.28
|
0.47
|
0.90
|
0.62
|
0.89
|
0.65
|
|
average
|
0.59
|
0.73
|
0.65
|
0.32
|
0.69
|
0.88
|
0.55
|
0.73
|
0.07
|
As we can see from table 1, Russia’s bilateral trade in travel services with Poland demonstrates the highest intra-industry trade intensity. The average GL index value during the analyzed period was 0.88, and the highest value was 1 in 2016 (perfect intra-industry trade). The opposite situation is observed in bilateral trade with Finland (GL index is stable low with a slight downward trend). Concerning another EU country Germany, we can observe significant fluctuations of the index value from the highest of 0.7 in 2007 to the lowest of 0.36 in 2015, with an average value of 0.55 for 15 years studied.
The most substantial and stable growth in the intensity of intra-industry trade in travel services was found in relation to China. GL index increased sharply from 0.34 in 2002 to 0.87 in 2018 due to the growth of China’s export share. According to Russian border control statistics, in 2006-2008 for every Chinese tourist in Russia, there were 3-4 Russians who visited China, but since 2011 the ratio has become steadily closer, amounting to 1: 1.4 people in 2018 [50]. The Belt and Road Initiative provided excellent conditions for the development of tourism cooperation between China and Russia. Chinese tourism products have a unique oriental cultural charm, which makes them very popular among Russian tourists. In turn, the historical and cultural features of the specific mixture of east and west in Russian culture and the socialist past also attract many Chinese tourists [62] (Song, 2019). Russia is the fifth tourist donor country for China, with a share of 8% in inbound flow in 2018 [63], and China ranks third in the structure of the inbound flow to Russia with a share of 7% [50]. The last 10–15 years witnessed a rapid expansion of intra-industry trade in travel services between these countries.
Results for CIS countries (Ukraine, Kazakhstan, and Azerbaijan) showed a distinct downward trend of intra-industry trade intensity. GL index value gradually dropped from high values (0.8–0.9) to less than 0.5, with the lowest value of 0.22 for Ukraine in 2018.
Zero values of GL index were measured in relation to Egypt (exclusively inter-industry trade). Egypt, along with Turkey, has traditionally been the most popular outbound tourism destination for Russians, so imports significantly exceeded exports. The GL index started to rise only in 2016. However, this upward trend is associated not with an increase in exports, but with a sharp drop in imports, resulting in the suspension of all Russia’s flights to Egypt at the end of 2015.
The average GL index value of 0.73 for the USA confirms the existence of high-intensity intra-industry trade in travel services between Russia and the United States. Till 2009 we can notice almost perfect intra-industry trade, then its intensity started to decline and significantly rose again in 2018 with GL index reaching the value of 0.89.
To make the picture clearer, let us depict the results in Figure 3.
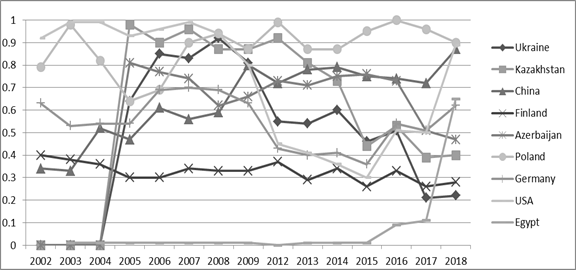
Figure 3. GL index of Russia’s trade in travel services in relation to chosen countries
Source: UN Comtrade Database, 2020, authors’ calculations. Retrieved from: https://comtrade.un.org/data. Date of access 01.06.2020.
The last step of our analysis is to calculate Fontagné and Freudenberg index and distinguish three types of trade: one-way trade (OWT), two-way trade horizontally differentiated (TWTH), and two-way trade vertically differentiated (TWTV), using the methodology proposed by Fontagne and Freudenberg (1997) [55] (Fontagne, Freudenberg, 1997). Table 2 and Table 3 reveal the results.
Table 2
Fontagné and Freudenberg index of Russia’s trade in travel services in relation to chosen countries
|
|
Ukraine
|
Kazakhstan
|
China
|
Finland
|
Azerbaijan
|
Poland
|
Germany
|
USA
|
Egypt
|
|
2002
|
n/a
|
n/a
|
21%
|
25%
|
n/a
|
65%
|
46%
|
85%
|
n/a
|
|
2003
|
n/a
|
n/a
|
20%
|
23%
|
n/a
|
97%
|
36%
|
98%
|
1%
|
|
2004
|
n/a
|
n/a
|
35%
|
22%
|
n/a
|
69%
|
37%
|
98%
|
0%
|
|
2005
|
47%
|
96%
|
31%
|
18%
|
68%
|
47%
|
37%
|
87%
|
0%
|
|
2006
|
75%
|
82%
|
43%
|
18%
|
63%
|
52%
|
52%
|
93%
|
0%
|
|
2007
|
70%
|
93%
|
38%
|
20%
|
58%
|
82%
|
54%
|
98%
|
0%
|
|
2008
|
85%
|
77%
|
42%
|
20%
|
44%
|
89%
|
53%
|
89%
|
0%
|
|
2009
|
68%
|
77%
|
67%
|
20%
|
49%
|
76%
|
46%
|
67%
|
0%
|
|
2012
|
38%
|
86%
|
56%
|
22%
|
57%
|
98%
|
28%
|
29%
|
0%
|
|
2013
|
37%
|
68%
|
63%
|
17%
|
55%
|
77%
|
25%
|
26%
|
0%
|
|
2014
|
43%
|
57%
|
65%
|
21%
|
60%
|
77%
|
26%
|
22%
|
0%
|
|
2015
|
30%
|
28%
|
60%
|
15%
|
61%
|
90%
|
22%
|
18%
|
0%
|
|
2016
|
34%
|
36%
|
58%
|
20%
|
58%
|
100%
|
37%
|
34%
|
5%
|
|
2017
|
12%
|
24%
|
56%
|
15%
|
35%
|
92%
|
34%
|
34%
|
6%
|
|
2018
|
13%
|
25%
|
77%
|
16%
|
31%
|
82%
|
45%
|
80%
|
48%
|
Table 3
Types of Russia’s foreign trade in travel services with selected countries
|
|
2005
|
2006
|
2008
|
2017
|
|
Ukraine
|
TWTV
|
n/a
|
n/a
|
TWTV
|
|
Kazakhstan
|
TWTV
|
TWTV
|
TWTV
|
n/a
|
|
China
|
TWTV
|
TWTV
|
TWTV
|
n/a
|
|
Finland
|
TWTV
|
TWTV
|
TWTV
|
TWTV
|
|
Azerbaijan
|
TWTV
|
TWTV
|
TWTV
|
TWTV
|
|
Poland
|
TWTV
|
TWTV
|
TWTV
|
TWTH
|
|
Germany
|
TWTV
|
TWTV
|
TWTV
|
TWTV
|
|
USA
|
TWTV
|
TWTV
|
TWTV
|
TWTV
|
|
Egypt
|
OWT
|
OWT
|
OWT
|
OWT
|
The findings confirm the existence of two-way (intra-industry) trade in travel services with all chosen countries except Egypt. The average FF index (excluding the one for Egypt) over the entire period range from 19% (Finland) to 80% (Poland). Results confirmed the existence of high-intensity intra-industry trade in travel services with Poland, the US, and China, with the most substantial growth observed in relation to China. The average FF indexes for CIS countries are also high but have a pronounced downward trend. The trade with Egypt (except 2018) is one way (inter-industry). Two-way trade is mostly vertically differentiated in relation to all chosen countries over the analyzed period.
6. Conclusion
The purpose of this study was to explore Russia’s intra-industry trade in travel services. The analysis was performed in relation to the world and several important countries over the period 2002-2018. Using the Grubel-Lloyd index and methodology proposed by Fontagné and Freudenberg, we investigated the intensity of intra-industry trade in travel services between Russia and chosen important countries and disentangle flows into three categories: one-way trade, two-way trade horizontally differentiated, and two-way trade vertically differentiated.
During the last 15–20 years, the share of tourism in the GDP of many countries expanded significantly, trade in travel services increased in both exports and imports and has become an essential part of international trade for many economies. Our empirical analysis confirms the existence of medium intensity intra-industry trade in Russia’s foreign trade in travel services in relation to the world. The average GL indexes in relation to chosen countries (excluding Egypt) range from 32.0% (Finland) to 88% (Poland). This finding confirms the importance of intra-industry trade in travel services for Russia and selected countries. Fontagné and Freudenberg index provided the similar result.
The findings support Leitao (2011) [7] (Leitão, 2011)assertion about a correlation between the theory of international trade and tourism. That is, trade in travel services can be associated with product differentiation, increasing returns of scale, and imperfect competition.
The highest level of intra-industry trade was found in the bilateral tourism trade with Poland. Significant increase in the level of IIT observed in relation to China. These results can support Nowak's statement that cultural and geographic proximity is an essential determinant of intra-industry trade in travel services [13] (Nowak et al., 2012). However, our empirical results show no evidence this statement is right in the case of Russia’s trade with Finland, the USA, or CIS countries. Thus, the average GL index is relatively low for Russia’s trade with Finland (common border with 11 border checkpoints) and rather high for trade with the United States, despite the long geographical distance and the absence of any common cultural background.
An unexpected result was also found in relation to CIS countries. Although Russia has common borders with all CIS countries as well as common past and close relations throughout history, our findings show that indexes of intra-industry trade in travel services demonstrate a pronounced downward trend. These results are different from the findings of Gusev (2007) and Gurova and Efremova (2012), who discovered that the highest level of intra-industry trade intensity exists in merchandise trade between Russia and CIS countries [47, 48] (Gusev, 2007, Gurova, Efremova, 2012).
The trade in travel services with Egypt for most of the years studied is one-way (inter-industry). This finding can be explained by the fact that Egypt has an apparent comparative advantage in the tourism industry [64] (Nowak et al., 2010), so the result is consistent with the traditional image of international trade in travel services, which assume the existence of polarization between host and source countries [13] (Nowak et al., 2012).
Our study also confirmed the predominance of vertical intra-tourism trade, found by Nowak et al. [13] (Nowak et al., 2012).
For further tourism trade research, we suggest studying the determinants of intra-industry trade in travel services. Our particular interest lies in investigating Russia’s intra-industry trade in travel services in relation to China since it demonstrates a distinct upward trend.
[1] For this study, i stands for Russian Federation and j stands for one of the 9 selected important trade partners, k stands for travel services
[2] X (M) – export (import) value for the good or service k; i and j – trade partners. For this study, i stands for Russian Federation, j stands for one of the 9 selected important trade partners, k stands for travel services
Источники:
2. WTTC (2020). Economic Impact Reports. Retrieved from: https://wttc.org/Research/Economic-Impact. (date of access 01.06.2020).
3. UNWTO (2020). World Tourism Barometer. Retrieved from: https://www.e-unwto.org/doi/epdf/10.18111/wtobarometereng.2020.18.1.1 (date of access 01.06.2020).
4. Ferro-Luzzi, G., & Flückiger, Y. (2003). Tourism and international trade: introduction. Pacific Economic Review, 8(3), 239-243.
5. WTTC (2006). The Russian Federation: the impact of travel and tourism on jobs and the economy. Retrieved from: http://www.ontit.it/opencms/export/sites/default/ont/it/documenti/archivio/files/ONT_2006-02-01_00169.pdf. (date of access 01.06.2020).
6. Knoema (2020). World Data Atlas. Retrieved from: https://knoema.com/atlas/topics/Tourism/Travel-and-Tourism-Total-Contribution-to-GDP/Contribution-of-travel-and-tourism-to-GDP-percent-of-GDP (date of access 01.06.2020).
7. Leitão, N. C. (2011). Intra-industry trade in tourism services. Theoretical and Applied Economics, 55-62.
8. Verdoorn, P. J. (1960). The Intra-Bloc Trade of Benelux. In E. A. G. Robinson (Ed.), Economic Consequences of the Size of Nations. Proceedings of a Conference Held by the International Economic Association (pp. 291–329). London, New York.
9. Balassa, B. A. (1966). Tariff Reductions and Trade in Manufactures among Industrial Countries. American Economics Review, 56(3), 466-273.
10. Helpman, E., & Krugman, P. R. (1985). Market Structure and Foreign Trade. Increasing Returns, Imperfect Competition, and the International Economy. Cambridge: MA: MIT Press, 283.
11. Leitao, N. (2012). The determinants of intra-industry trade in the tourism services. MPRA Paper No. 37444. Retrieved from: https://mpra.ub.uni-muenchen.de/37444/ (date of access 01.06.2020).
12. Ledgerwood, J. R., Ekanayake, E. M., & Halkides, M. (2006). Follow Intra-Industry Specialization and Trade Expansion in U.S. Trade with the Free Trade Areas of the Americas (FTAA). Journal of International Business and Economics, 6(1), 21-36.
13. Nowak, J.-J., Petit, S., & Sahli, M. (2012). Intra-tourism trade in Europe. Tourism Economics, 18(6), 1287-1311.
14. Martin-Montaner, J. A., & Rios, V. O. (2002). Vertical specialization and intra-industry trade: The role of factor endowments. Review of World Economics, 138(2), 340-365.
15. Zhang, J., Van Witteloostuijn, A., & Zhou, C. (2005). Chinese bilateral intra-industry trade: A panel data study for 50 countries in the 1992-2001 period. Review of World Economics, 141(3), 510-540.
16. Ding, X. (2016). Research on the level of intra-industry trade in the service sector between China and Germany. Northern Economy and Trade, 3, 3-6.
17. Bojnec, S. (2004). Patterns of Intra-Industry Trade in Agricultural and Food Products during Transition Eastern European Economics, 39(1), 61-89.
18. Sharma, K. (2000). The pattern and determinants of intra-industry trade in Australian manufacturing. Australian Economic Review, 33(3), 245-255.
19. Ishchukova, N., & Smutka, L. (2014). Russia’s intra-industry trade in agricultural products: the extent and major trends. Journal of Central European green innovation, 2(1), 75-89.
20. Falvey, R. E., & Kierzkowski, H. (1985). Product quality, intra-industry trade and (im)perfect competition. In H. Kierzkowski (Ed.), Protection and competition in international trade (pp. 143-161). Oxford: Blackwell.
21. Jambor, A. (2013). Country-specific determinants of horizontal and vertical intra-industry agri-food trade of the Visegrad Countries. FIW Working Paper, 104.
22. Aturupane, C., Djankov, S., & Hoekman, B. (1999). Horizontal and Vertical Intra-Industry Trade between Eastern Europe and the European Union. Weltwirtschaftliches Archiv, 135, 62-81.
23. Fontagné, L., Freudenberg, M., & Gaulier, G. (2006). A Systematic Decomposition of World Trade into Horizontal and Vertical IIT. Review of World Economics, 142(3), 459-475.
24. Gabrish, H. (2006). Vertical Intra-industry Trade between EU and Accessions Countries. IWH Discussion Paper No 12-06. Retrieved from: https://ideas.repec.org/p/zbw/iwhdps/iwh-12-06.html (date of access 01.06.2020).
25. Hurley, D. T. (2003). Horizontal and Vertical IIT: The case of Asian trade in manufactures. International Economic Journal, 14(4), 1-14.
26. Kaitila, V. (1999). Trade and Revealed Comparative Advantage: Hungary, the Czech Republic, and the European Union. BOFIT Discussion Paper No. 8), Retrieved from: https://www.econstor.eu/bitstream/10419/212467/1/bofit-dp1999-008.pdf (date of access 01.06.2020).
27. Ando, M. (2006). Fragmentation and vertical intra-industry trade in East Asia. North American Journal of Economics and Finance, 17, 257-281.
28. Fainstein, G., & Netsunajev, A. (2011). Estonian Intra-Indusrty Trade Development in 1999-2007. In J. Sepp & D. Frear (Eds.), The Economy and Economics After Crisis (pp. 183-194). Berlin: Berliner Wissenschafts-Verlag.
29. Hindley, B., & Smith, A. (1984). Comparative Advantage and Trade in Services. The World Economy, 7(4), 369-380.
30. Kierzkowski, H. (1989). Intra-Industry Trade in Transportation Services. In P. K. M. T. J. Kol (Ed.), Intra-Industry Trade: Theory, Evidence and Extensions (pp. 92-100). London: Macmillan.
31. Lee, H.-H., & Lloyd, P. J. (2002). Intra-industry trade in services. In Lloyd, P.J. and Lee, H. H. (eds), Frontiers of Research in Intra-Industry Trade (p. 159-179), Basingstoke: Palgrave Macmillan.
32. Samarina, A., & Wang, S. (2018). Intra-industry trade in services between Russia and China. In E. Serebrennikova (Ed.), Fundamental and actual problems of oriental and regional studies of the countries of the Asia-Pacific region (Vol. 2, pp. 252-260). Irkutsk: ISU.
33. Linders, G. J. (2001). Theory, Methodology and descriptive Statistics on Services and Services. CPB Memorandum. Retrieved from: https://www.cpb.nl/sites/default/files/publicaties/download/memo10.pdf (date of access 01.06.2020).
34. Shelburne, R., & Gonzalez, J. (2004). The Role of Intra-industry Trade in the Service Sector. In P. M.G. (Ed.), Empirical Methods in International Trade: Essays in Honor of Mordechai Kreinin (chapter 7). UK: Edward Elgar Publishing.
35. Sichei, M. M., Harmse, C., & Kanfer, F. (2007). Determinants of South Africa - US intra-industry trade in services: a wild bootstrap dynamic panel data analysis. South African Journal of Economics, 75(3), 521-539.
36. Tang, L. (1999). Intra-Industry Trade in Services: A Case Study of the International Telephone Industry. Mimeo, Drexel University.
37. Tang, L. (2003). The determinants of international telephone traffic imbalances. Information Economics and Policy, 115, 127-145.
38. Francois, J. F., & Wooton, I. (2001). Trade in International Transport Services: The Role of Competition. Review of International Economics, 9(2), 249-261.
39. Li, D, Moshirian, F., and Sim, A.-B. (2003). The determinants of intra-industry trade in insurance services The Journal of Risk and Insurance, 70(2), 269-287.
40. Moshirian, F., Li, D., & Sim, A.-B. (2005). Intra-industry trade in financial services. Journal of International Money and Finance, 24, 1090-1107.
41. Webster, A., & Hardwick, P. (2005). International trade in financial services The Service Industries Journal, 25, 721-746.
42. Blaskova, M., & Skultety, F. (2015). U.S. intra-industry trade in air transport services: Measurement and results. Transport Problems, 10(2), 15-22.
43. Webster, A., Fletcher, J., Hardwick, P., & Morakabati, Y. (2007). Tourism and empirical applications of international trade theory: a multi-country analysis. Tourism Economics, 13(4), 657-674
44. Hu, Y., Han, L., & Li, D. (2008). Intra-Industry Trade in International Tourism Services. 4th International Conference on Wireless Communications, Networking and Mobile Computing Conference Paper, Retrieved from: https://ieeexplore.ieee.org/document/4680259 (date of access 01.06.2020).
45. Hanna, J., Levi, L., & Petit, S. (2015). Intra-tourism trade, income distribution and tourism endowment: an econometric investigation. Applied Economics, 47(21), 2184-2200.
46. Algieri, B. (2004). Trade specialization patterns: The case of Russia. BOFIT Discussion Paper No. 19. Retrieved from: https://ideas.repec.org/p/bof/bofitp/2004_019.html (date of access 01.06.2020.
47. Gusev, M. (2007). Russia’s intra-industry trade in international exchange: major trends and growth potential, Studies on Russian Economic Development, 18(2), 196-205.
48. Gurova, I., & Efremova, M. (2012). Intra-industry and inter-industry trade between CIS countries. Eurasion Economic Integration, 3(16), 30-39.
49. United Nations Comtrade database. Retrieved from: https://comtrade.un.org/data (date of access 01.06.2020).
50. Unified Interagency Information Statistical System of Russian Federation. Retrieved from: https://www.fedstat.ru/indicator/59466, date of access 01.06.2020.
51. Grubel, H., & Lloyd, P. J. (1975). Intra-industry Trade: The Theory and Measurement of International Trade with Differentiated Products. London: Macmillan, 205.
52. Anderson, M. A. (2003). Empirical Intra-Industry Trade: What we know and what we need to know. Canada: University of British Columbia, 57.
53. Abd-El-Rahman, K. S. (1986a). La 'différence' et la 'similitude' dans l'analyse de la composition du commerce international. Revue économique, 37(2), 307-339.
54. Abd-El-Rahman, K. (1986(b)). Réexamen de la définition et de la mesure des échanges croisés de produits similaires entre les nations. Revue économique, 37(1), 59-116.
55. Fontagne, L., & Freudenberg, M. (1997). Intra-industry trade: Methodological issues reconsidered. CEPII Working Paper No 97-01, No. 19. Retrieved from: http://www.cepii.fr/PDF_PUB/wp/1997/wp1997-01.pdf (date of access 01.06.2020).
56. Abd-El-Rahman, K. (1991). Firm’s Competitive and National Comparative Advantage as Joint Determinants of Trade Composition. Weltwirtschaftliches Archiv, 127, 83-97.
57. Azhar, A. K. M., & Elliott, R. J. R. (2006). On the Measurement of Product Quality in IIT. Review of World Economics, 142(3), 476-495.
58. Fontagné, L., & Freudenberg, M. (2002). Long Term Trends in Intra-Industry Trade. In H.-H. L. P. J. Lloyd (Ed.), Frontiers of Research on Intra-industry Trade (pp. 131-158). Basingstoke: Palgrave Macmillan.
59. Greenaway, D., Hine, C. R., & Milner, C. R. (1994). Country Specific Factors and the Pattern of Horizontal and Vertical Intra-Industry in the UK. Weltwirtschaftliches Archiv, 130(1), 77-100.
60. Greenaway, D., Hine, C. R., & Milner, C. R. (1995). Vertical and Horizontal Intra-Industry Trade: A Cross Country Analysis for the United-Kingdom. Economic Journal, 105(433), 1505-1518.
61. Gössling, S., Scott, D., & Hall, M. (2018). Global trends in length of stay: implications for destination management and climate change. Journal of Sustainable Tourism, 26(12), 2087-2101.
62. Song, Z. (2019). Analysis of Influencing Factors of Sino-Russian Tourism Cooperation under Belt and Road Initiative. Journal of Henan Institute of Education (Philosophy and Social Sciences Edition), 38(6), 59-63.
63. The yearbooks of China tourism statistics, annual, 2002-2018. Retrived from: https://www.chinayearbooks.com/tags/the-yearbook-of-china-tourism-statistics. Date of access 01.06.2020.
64. Nowak, J.-J., Petit, S., & Sahli, M. (2010). Tourism and Globalization: The International Division of Tourism Production. Journal of travel research, 49, 228-245
Страница обновлена: 28.03.2024 в 16:48:24